

Select Times in Timetable
A timetable is a type of table that associates a time with each row. You can select time-based subsets
of its data in several ways:
• Find times within a certain range using the timerange or withtol functions.
• Match recurring units of time, such as days or months, using the components of datetime arrays.
• Resample or group data with the retime function.
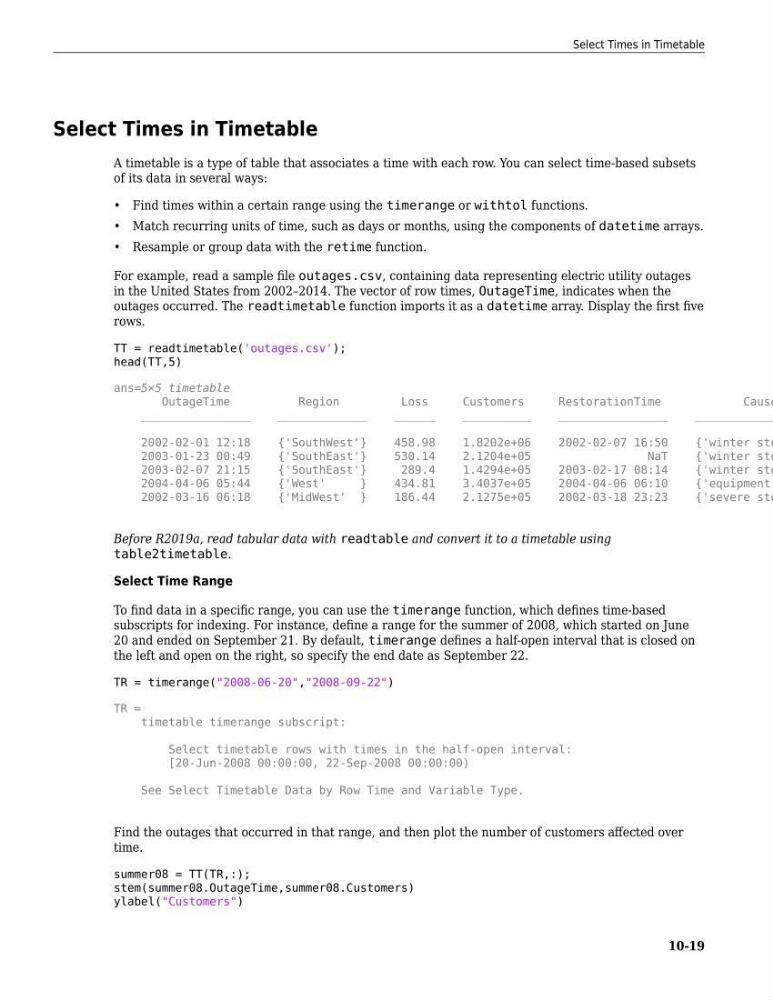
For example, read a sample file outages.csv, containing data representing electric utility outages
in the United States from 2002–2014. The vector of row times, OutageTime, indicates when the
outages occurred. The readtimetable function imports it as a datetime array. Display the first five
rows.
TT = readtimetable('outages.csv');
head(TT,5)
ans=5×5 timetable
OutageTime
Region
Loss
Customers
RestorationTime
Cause
________________
_____________
______
__________
________________
____________
2002-02-01 12:18
{'SouthWest'}
458.98
1.8202e+06
2002-02-07 16:50
{'winter sto
2003-01-23 00:49
{'SouthEast'}
530.14
2.1204e+05
NaT
{'winter sto
2003-02-07 21:15
{'SouthEast'}
289.4
1.4294e+05
2003-02-17 08:14
{'winter sto
2004-04-06 05:44
{'West'
}
434.81
3.4037e+05
2004-04-06 06:10
{'equipment
2002-03-16 06:18
{'MidWest' }
186.44
2.1275e+05
2002-03-18 23:23
{'severe sto
Before R2019a, read tabular data with readtable and convert it to a timetable using
table2timetable.
Select Time Range
To find data in a specific range, you can use the timerange function, which defines time-based
subscripts for indexing. For instance, define a range for the summer of 2008, which started on June
20 and ended on September 21. By default, timerange defines a half-open interval that is closed on
the left and open on the right, so specify the end date as September 22.
TR = timerange("2008-06-20","2008-09-22")
TR =
timetable timerange subscript:
Select timetable rows with times in the half-open interval:
[20-Jun-2008 00:00:00, 22-Sep-2008 00:00:00)
See Select Timetable Data by Row Time and Variable Type.
Find the outages that occurred in that range, and then plot the number of customers affected over
time.
summer08 = TT(TR,:);
stem(summer08.OutageTime,summer08.Customers)
ylabel("Customers")
Select Times in Timetable
10-19
A timetable is a type of table that associates a time with each row. You can select time-based subsets
of its data in several ways:
• Find times within a certain range using the timerange or withtol functions.
• Match recurring units of time, such as days or months, using the components of datetime arrays.
• Resample or group data with the retime function.
For example, read a sample file outages.csv, containing data representing electric utility outages
in the United States from 2002–2014. The vector of row times, OutageTime, indicates when the
outages occurred. The readtimetable function imports it as a datetime array. Display the first five
rows.
TT = readtimetable('outages.csv');
head(TT,5)
ans=5×5 timetable
OutageTime
Region
Loss
Customers
RestorationTime
Cause
________________
_____________
______
__________
________________
____________
2002-02-01 12:18
{'SouthWest'}
458.98
1.8202e+06
2002-02-07 16:50
{'winter sto
2003-01-23 00:49
{'SouthEast'}
530.14
2.1204e+05
NaT
{'winter sto
2003-02-07 21:15
{'SouthEast'}
289.4
1.4294e+05
2003-02-17 08:14
{'winter sto
2004-04-06 05:44
{'West'
}
434.81
3.4037e+05
2004-04-06 06:10
{'equipment
2002-03-16 06:18
{'MidWest' }
186.44
2.1275e+05
2002-03-18 23:23
{'severe sto
Before R2019a, read tabular data with readtable and convert it to a timetable using
table2timetable.
Select Time Range
To find data in a specific range, you can use the timerange function, which defines time-based
subscripts for indexing. For instance, define a range for the summer of 2008, which started on June
20 and ended on September 21. By default, timerange defines a half-open interval that is closed on
the left and open on the right, so specify the end date as September 22.
TR = timerange("2008-06-20","2008-09-22")
TR =
timetable timerange subscript:
Select timetable rows with times in the half-open interval:
[20-Jun-2008 00:00:00, 22-Sep-2008 00:00:00)
See Select Timetable Data by Row Time and Variable Type.
Find the outages that occurred in that range, and then plot the number of customers affected over
time.
summer08 = TT(TR,:);
stem(summer08.OutageTime,summer08.Customers)
ylabel("Customers")
Select Times in Timetable
10-19