

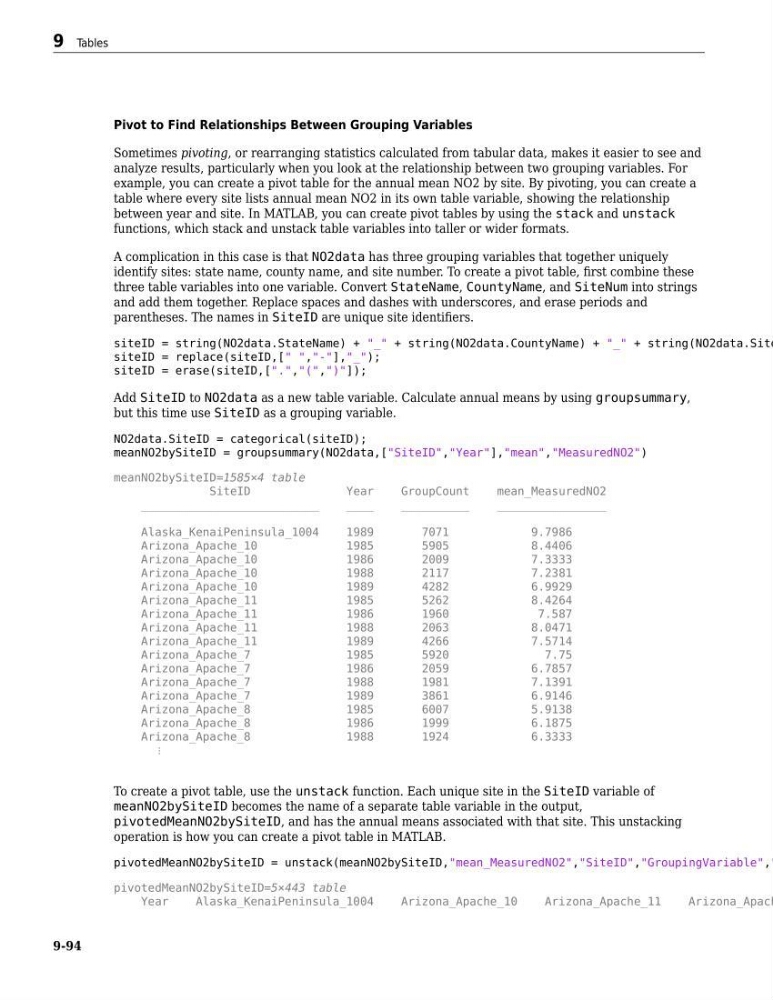
Pivot to Find Relationships Between Grouping Variables
Sometimes pivoting, or rearranging statistics calculated from tabular data, makes it easier to see and
analyze results, particularly when you look at the relationship between two grouping variables. For
example, you can create a pivot table for the annual mean NO2 by site. By pivoting, you can create a
table where every site lists annual mean NO2 in its own table variable, showing the relationship
between year and site. In MATLAB, you can create pivot tables by using the stack and unstack
functions, which stack and unstack table variables into taller or wider formats.
A complication in this case is that NO2data has three grouping variables that together uniquely
identify sites: state name, county name, and site number. To create a pivot table, first combine these
three table variables into one variable. Convert StateName, CountyName, and SiteNum into strings
and add them together. Replace spaces and dashes with underscores, and erase periods and
parentheses. The names in SiteID are unique site identifiers.
siteID = string(NO2data.StateName) + "_" + string(NO2data.CountyName) + "_" + string(NO2data.Site
siteID = replace(siteID,[" ","-"],"_");
siteID = erase(siteID,[".","(",")"]);
Add SiteID to NO2data as a new table variable. Calculate annual means by using groupsummary,
but this time use SiteID as a grouping variable.
NO2data.SiteID = categorical(siteID);
meanNO2bySiteID = groupsummary(NO2data,["SiteID","Year"],"mean","MeasuredNO2")
meanNO2bySiteID=1585×4 table
SiteID
Year
GroupCount
mean_MeasuredNO2
__________________________
____
__________
________________
Alaska_KenaiPeninsula_1004
1989
7071
9.7986
Arizona_Apache_10
1985
5905
8.4406
Arizona_Apache_10
1986
2009
7.3333
Arizona_Apache_10
1988
2117
7.2381
Arizona_Apache_10
1989
4282
6.9929
Arizona_Apache_11
1985
5262
8.4264
Arizona_Apache_11
1986
1960
7.587
Arizona_Apache_11
1988
2063
8.0471
Arizona_Apache_11
1989
4266
7.5714
Arizona_Apache_7
1985
5920
7.75
Arizona_Apache_7
1986
2059
6.7857
Arizona_Apache_7
1988
1981
7.1391
Arizona_Apache_7
1989
3861
6.9146
Arizona_Apache_8
1985
6007
5.9138
Arizona_Apache_8
1986
1999
6.1875
Arizona_Apache_8
1988
1924
6.3333
⋮
To create a pivot table, use the unstack function. Each unique site in the SiteID variable of
meanNO2bySiteID becomes the name of a separate table variable in the output,
pivotedMeanNO2bySiteID, and has the annual means associated with that site. This unstacking
operation is how you can create a pivot table in MATLAB.
pivotedMeanNO2bySiteID = unstack(meanNO2bySiteID,"mean_MeasuredNO2","SiteID","GroupingVariable","
pivotedMeanNO2bySiteID=5×443 table
Year
Alaska_KenaiPeninsula_1004
Arizona_Apache_10
Arizona_Apache_11
Arizona_Apach
9 Tables
9-94
Sometimes pivoting, or rearranging statistics calculated from tabular data, makes it easier to see and
analyze results, particularly when you look at the relationship between two grouping variables. For
example, you can create a pivot table for the annual mean NO2 by site. By pivoting, you can create a
table where every site lists annual mean NO2 in its own table variable, showing the relationship
between year and site. In MATLAB, you can create pivot tables by using the stack and unstack
functions, which stack and unstack table variables into taller or wider formats.
A complication in this case is that NO2data has three grouping variables that together uniquely
identify sites: state name, county name, and site number. To create a pivot table, first combine these
three table variables into one variable. Convert StateName, CountyName, and SiteNum into strings
and add them together. Replace spaces and dashes with underscores, and erase periods and
parentheses. The names in SiteID are unique site identifiers.
siteID = string(NO2data.StateName) + "_" + string(NO2data.CountyName) + "_" + string(NO2data.Site
siteID = replace(siteID,[" ","-"],"_");
siteID = erase(siteID,[".","(",")"]);
Add SiteID to NO2data as a new table variable. Calculate annual means by using groupsummary,
but this time use SiteID as a grouping variable.
NO2data.SiteID = categorical(siteID);
meanNO2bySiteID = groupsummary(NO2data,["SiteID","Year"],"mean","MeasuredNO2")
meanNO2bySiteID=1585×4 table
SiteID
Year
GroupCount
mean_MeasuredNO2
__________________________
____
__________
________________
Alaska_KenaiPeninsula_1004
1989
7071
9.7986
Arizona_Apache_10
1985
5905
8.4406
Arizona_Apache_10
1986
2009
7.3333
Arizona_Apache_10
1988
2117
7.2381
Arizona_Apache_10
1989
4282
6.9929
Arizona_Apache_11
1985
5262
8.4264
Arizona_Apache_11
1986
1960
7.587
Arizona_Apache_11
1988
2063
8.0471
Arizona_Apache_11
1989
4266
7.5714
Arizona_Apache_7
1985
5920
7.75
Arizona_Apache_7
1986
2059
6.7857
Arizona_Apache_7
1988
1981
7.1391
Arizona_Apache_7
1989
3861
6.9146
Arizona_Apache_8
1985
6007
5.9138
Arizona_Apache_8
1986
1999
6.1875
Arizona_Apache_8
1988
1924
6.3333
⋮
To create a pivot table, use the unstack function. Each unique site in the SiteID variable of
meanNO2bySiteID becomes the name of a separate table variable in the output,
pivotedMeanNO2bySiteID, and has the annual means associated with that site. This unstacking
operation is how you can create a pivot table in MATLAB.
pivotedMeanNO2bySiteID = unstack(meanNO2bySiteID,"mean_MeasuredNO2","SiteID","GroupingVariable","
pivotedMeanNO2bySiteID=5×443 table
Year
Alaska_KenaiPeninsula_1004
Arizona_Apache_10
Arizona_Apache_11
Arizona_Apach
9 Tables
9-94