

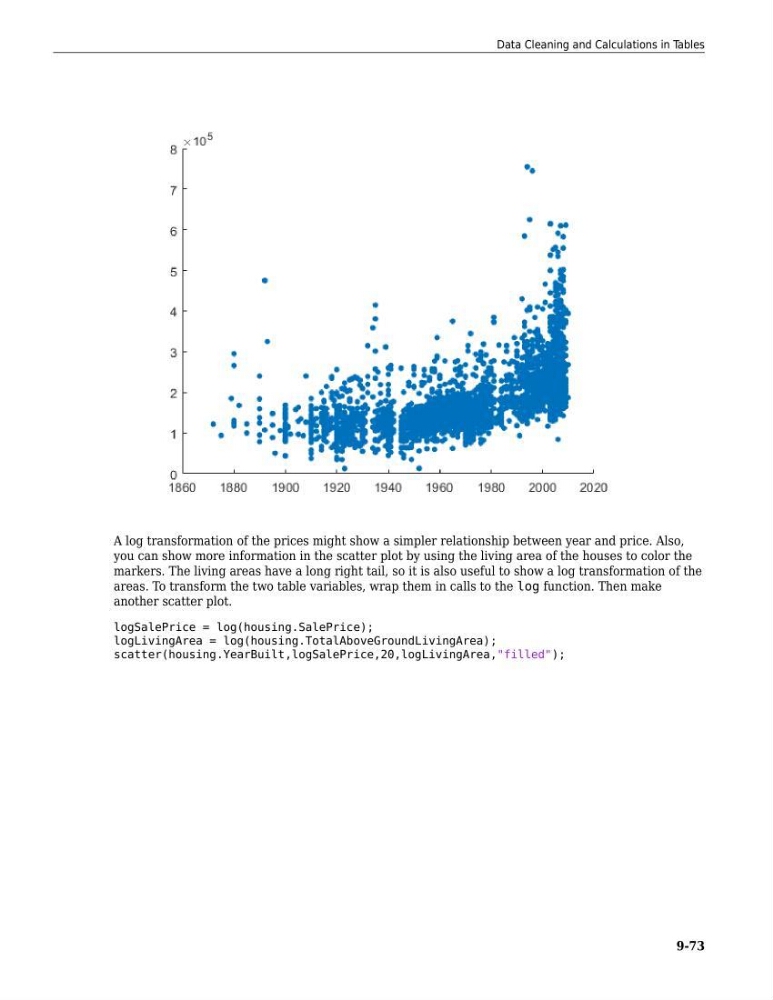
A log transformation of the prices might show a simpler relationship between year and price. Also,
you can show more information in the scatter plot by using the living area of the houses to color the
markers. The living areas have a long right tail, so it is also useful to show a log transformation of the
areas. To transform the two table variables, wrap them in calls to the log function. Then make
another scatter plot.
logSalePrice = log(housing.SalePrice);
logLivingArea = log(housing.TotalAboveGroundLivingArea);
scatter(housing.YearBuilt,logSalePrice,20,logLivingArea,"filled");
Data Cleaning and Calculations in Tables
9-73
you can show more information in the scatter plot by using the living area of the houses to color the
markers. The living areas have a long right tail, so it is also useful to show a log transformation of the
areas. To transform the two table variables, wrap them in calls to the log function. Then make
another scatter plot.
logSalePrice = log(housing.SalePrice);
logLivingArea = log(housing.TotalAboveGroundLivingArea);
scatter(housing.YearBuilt,logSalePrice,20,logLivingArea,"filled");
Data Cleaning and Calculations in Tables
9-73