

T1 = T(:,'Cause');
[G,powerLosses] = findgroups(T1);
powerLosses.maxLoss = splitapply(@max,T.Loss,G)
powerLosses=10×2 table
Cause
maxLoss
________________
_______
attack
582.63
earthquake
258.18
energy emergency
11638
equipment fault
16659
fire
872.96
severe storm
8767.3
thunder storm
23418
unknown
23141
wind
2796
winter storm
2883.7
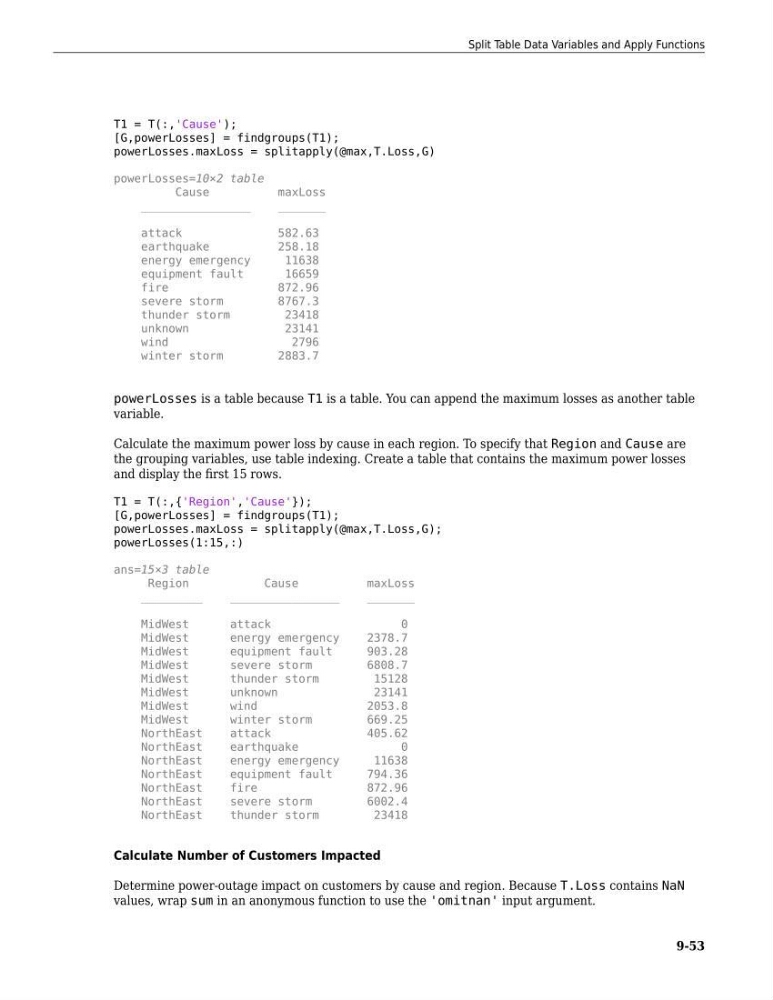
powerLosses is a table because T1 is a table. You can append the maximum losses as another table
variable.
Calculate the maximum power loss by cause in each region. To specify that Region and Cause are
the grouping variables, use table indexing. Create a table that contains the maximum power losses
and display the first 15 rows.
T1 = T(:,{'Region','Cause'});
[G,powerLosses] = findgroups(T1);
powerLosses.maxLoss = splitapply(@max,T.Loss,G);
powerLosses(1:15,:)
ans=15×3 table
Region
Cause
maxLoss
_________
________________
_______
MidWest
attack
0
MidWest
energy emergency
2378.7
MidWest
equipment fault
903.28
MidWest
severe storm
6808.7
MidWest
thunder storm
15128
MidWest
unknown
23141
MidWest
wind
2053.8
MidWest
winter storm
669.25
NorthEast
attack
405.62
NorthEast
earthquake
0
NorthEast
energy emergency
11638
NorthEast
equipment fault
794.36
NorthEast
fire
872.96
NorthEast
severe storm
6002.4
NorthEast
thunder storm
23418
Calculate Number of Customers Impacted
Determine power-outage impact on customers by cause and region. Because T.Loss contains NaN
values, wrap sum in an anonymous function to use the 'omitnan' input argument.
Split Table Data Variables and Apply Functions
9-53
[G,powerLosses] = findgroups(T1);
powerLosses.maxLoss = splitapply(@max,T.Loss,G)
powerLosses=10×2 table
Cause
maxLoss
________________
_______
attack
582.63
earthquake
258.18
energy emergency
11638
equipment fault
16659
fire
872.96
severe storm
8767.3
thunder storm
23418
unknown
23141
wind
2796
winter storm
2883.7
powerLosses is a table because T1 is a table. You can append the maximum losses as another table
variable.
Calculate the maximum power loss by cause in each region. To specify that Region and Cause are
the grouping variables, use table indexing. Create a table that contains the maximum power losses
and display the first 15 rows.
T1 = T(:,{'Region','Cause'});
[G,powerLosses] = findgroups(T1);
powerLosses.maxLoss = splitapply(@max,T.Loss,G);
powerLosses(1:15,:)
ans=15×3 table
Region
Cause
maxLoss
_________
________________
_______
MidWest
attack
0
MidWest
energy emergency
2378.7
MidWest
equipment fault
903.28
MidWest
severe storm
6808.7
MidWest
thunder storm
15128
MidWest
unknown
23141
MidWest
wind
2053.8
MidWest
winter storm
669.25
NorthEast
attack
405.62
NorthEast
earthquake
0
NorthEast
energy emergency
11638
NorthEast
equipment fault
794.36
NorthEast
fire
872.96
NorthEast
severe storm
6002.4
NorthEast
thunder storm
23418
Calculate Number of Customers Impacted
Determine power-outage impact on customers by cause and region. Because T.Loss contains NaN
values, wrap sum in an anonymous function to use the 'omitnan' input argument.
Split Table Data Variables and Apply Functions
9-53