

[G,gender,smoker] = findgroups(Gender,Smoker);
S = SelfAssessedHealthStatus;
I = ismember(S,{'Poor','Fair'});
numPatients = splitapply(@numel,S,G);
numPF = splitapply(@numel,S(I),G(I));
numPF./numPatients
ans = 4×1
0.2500
0.3846
0.3077
0.1429
Compare the standard deviation in Diastolic readings of those patients who report Poor or Fair
health, and those patients who report Good or Excellent health.
stdDiastolicPF = splitapply(@std,Diastolic(I),G(I));
stdDiastolicGE = splitapply(@std,Diastolic(~I),G(~I));
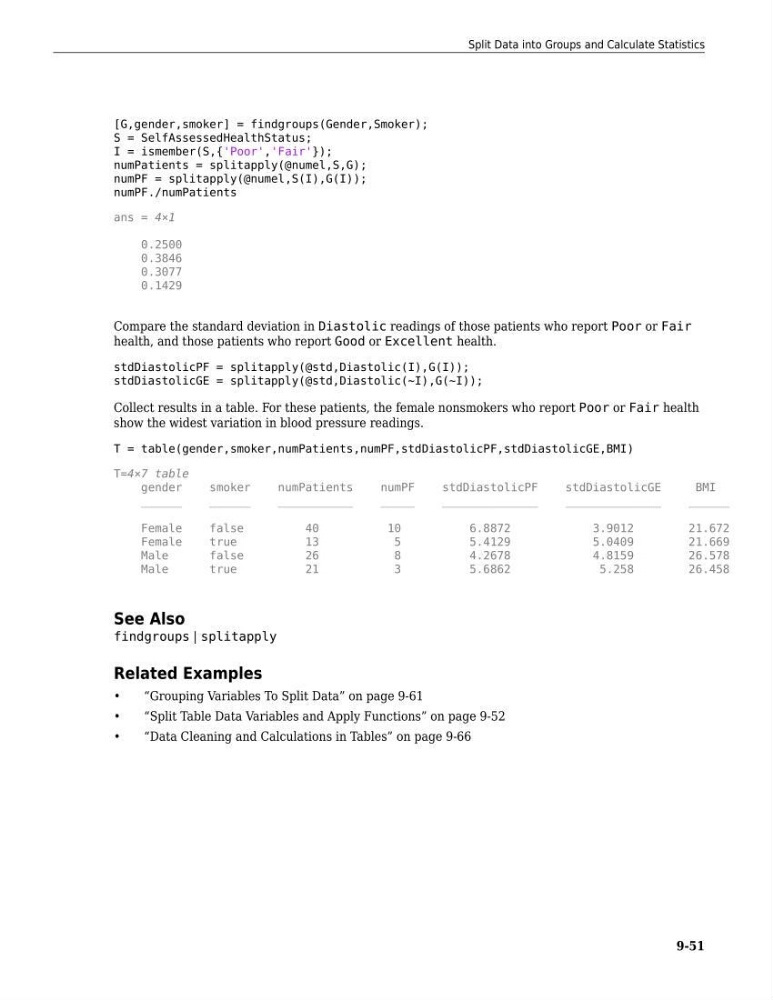
Collect results in a table. For these patients, the female nonsmokers who report Poor or Fair health
show the widest variation in blood pressure readings.
T = table(gender,smoker,numPatients,numPF,stdDiastolicPF,stdDiastolicGE,BMI)
T=4×7 table
gender
smoker
numPatients
numPF
stdDiastolicPF
stdDiastolicGE
BMI
______
______
___________
_____
______________
______________
______
Female
false
40
10
6.8872
3.9012
21.672
Female
true
13
5
5.4129
5.0409
21.669
Male
false
26
8
4.2678
4.8159
26.578
Male
true
21
3
5.6862
5.258
26.458
See Also
findgroups | splitapply
Related Examples
•
“Grouping Variables To Split Data” on page 9-61
•
“Split Table Data Variables and Apply Functions” on page 9-52
•
“Data Cleaning and Calculations in Tables” on page 9-66
Split Data into Groups and Calculate Statistics
9-51
S = SelfAssessedHealthStatus;
I = ismember(S,{'Poor','Fair'});
numPatients = splitapply(@numel,S,G);
numPF = splitapply(@numel,S(I),G(I));
numPF./numPatients
ans = 4×1
0.2500
0.3846
0.3077
0.1429
Compare the standard deviation in Diastolic readings of those patients who report Poor or Fair
health, and those patients who report Good or Excellent health.
stdDiastolicPF = splitapply(@std,Diastolic(I),G(I));
stdDiastolicGE = splitapply(@std,Diastolic(~I),G(~I));
Collect results in a table. For these patients, the female nonsmokers who report Poor or Fair health
show the widest variation in blood pressure readings.
T = table(gender,smoker,numPatients,numPF,stdDiastolicPF,stdDiastolicGE,BMI)
T=4×7 table
gender
smoker
numPatients
numPF
stdDiastolicPF
stdDiastolicGE
BMI
______
______
___________
_____
______________
______________
______
Female
false
40
10
6.8872
3.9012
21.672
Female
true
13
5
5.4129
5.0409
21.669
Male
false
26
8
4.2678
4.8159
26.578
Male
true
21
3
5.6862
5.258
26.458
See Also
findgroups | splitapply
Related Examples
•
“Grouping Variables To Split Data” on page 9-61
•
“Split Table Data Variables and Apply Functions” on page 9-52
•
“Data Cleaning and Calculations in Tables” on page 9-66
Split Data into Groups and Calculate Statistics
9-51