

Use the summary function to print a summary of Gender.
summary(Gender)
Female
53
Male
47
Gender is a 100-by-1 categorical array with two categories. Female occurs in 53 elements and Male
occurs in 47 elements.
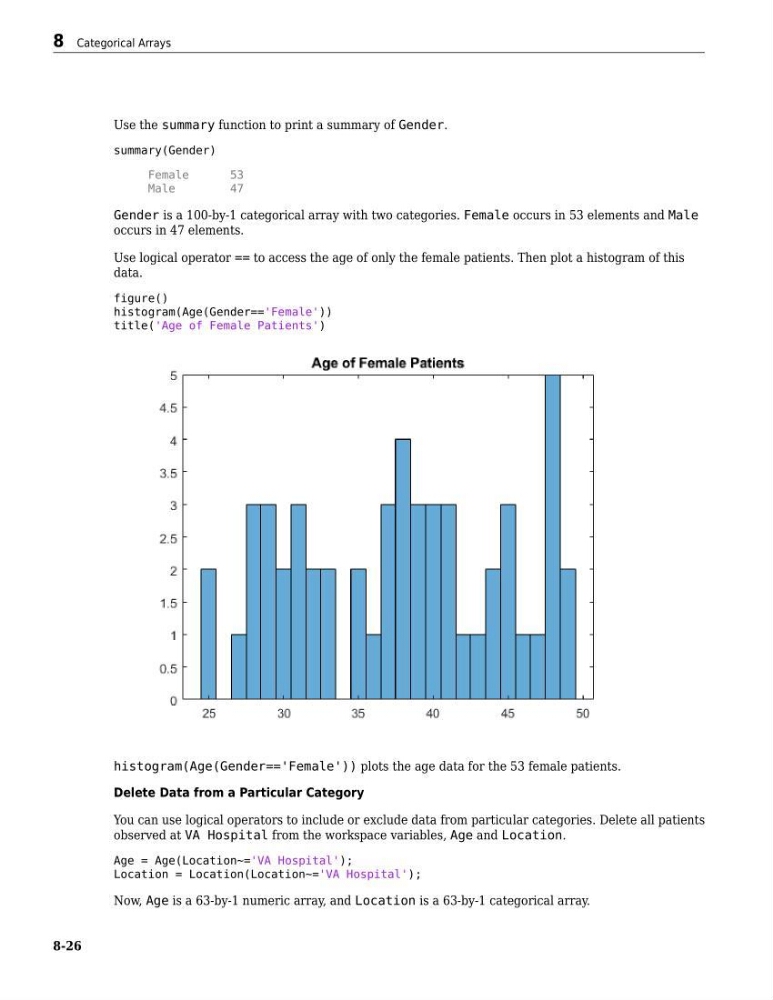
Use logical operator == to access the age of only the female patients. Then plot a histogram of this
data.
figure()
histogram(Age(Gender=='Female'))
title('Age of Female Patients')
histogram(Age(Gender=='Female')) plots the age data for the 53 female patients.
Delete Data from a Particular Category
You can use logical operators to include or exclude data from particular categories. Delete all patients
observed at VA Hospital from the workspace variables, Age and Location.
Age = Age(Location~='VA Hospital');
Location = Location(Location~='VA Hospital');
Now, Age is a 63-by-1 numeric array, and Location is a 63-by-1 categorical array.
8 Categorical Arrays
8-26
summary(Gender)
Female
53
Male
47
Gender is a 100-by-1 categorical array with two categories. Female occurs in 53 elements and Male
occurs in 47 elements.
Use logical operator == to access the age of only the female patients. Then plot a histogram of this
data.
figure()
histogram(Age(Gender=='Female'))
title('Age of Female Patients')
histogram(Age(Gender=='Female')) plots the age data for the 53 female patients.
Delete Data from a Particular Category
You can use logical operators to include or exclude data from particular categories. Delete all patients
observed at VA Hospital from the workspace variables, Age and Location.
Age = Age(Location~='VA Hospital');
Location = Location(Location~='VA Hospital');
Now, Age is a 63-by-1 numeric array, and Location is a 63-by-1 categorical array.
8 Categorical Arrays
8-26