

X2 and Y2 are 47-by-1 numeric arrays containing data from the male patients.
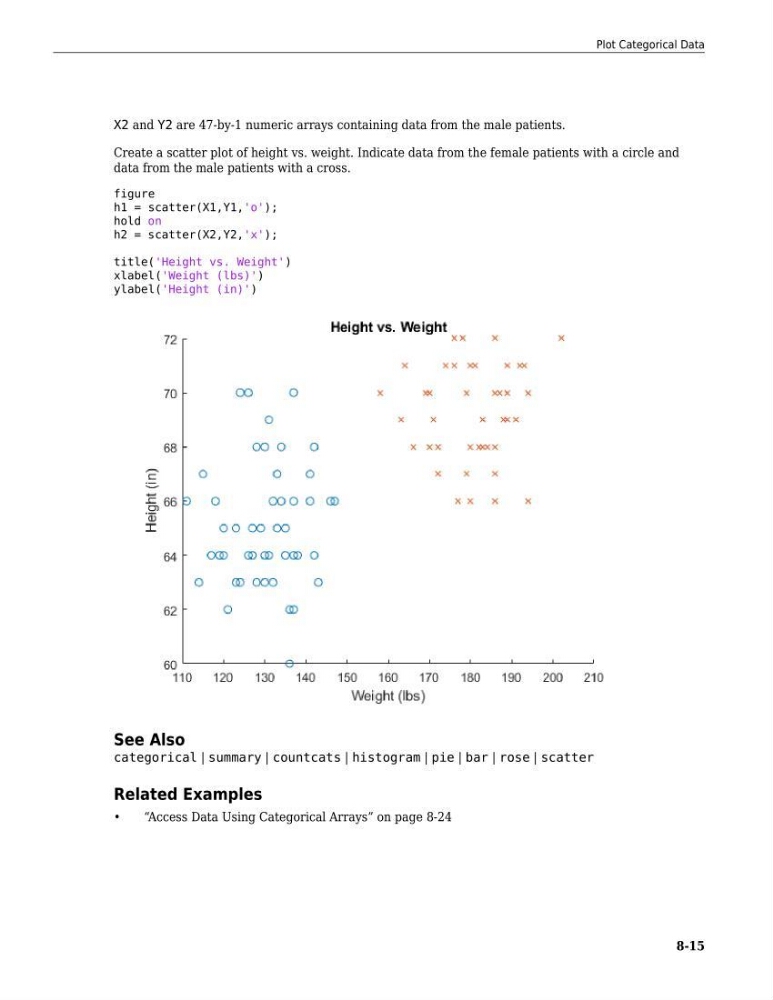
Create a scatter plot of height vs. weight. Indicate data from the female patients with a circle and
data from the male patients with a cross.
figure
h1 = scatter(X1,Y1,'o');
hold on
h2 = scatter(X2,Y2,'x');
title('Height vs. Weight')
xlabel('Weight (lbs)')
ylabel('Height (in)')
See Also
categorical | summary | countcats | histogram | pie | bar | rose | scatter
Related Examples
•
“Access Data Using Categorical Arrays” on page 8-24
Plot Categorical Data
8-15
Create a scatter plot of height vs. weight. Indicate data from the female patients with a circle and
data from the male patients with a cross.
figure
h1 = scatter(X1,Y1,'o');
hold on
h2 = scatter(X2,Y2,'x');
title('Height vs. Weight')
xlabel('Weight (lbs)')
ylabel('Height (in)')
See Also
categorical | summary | countcats | histogram | pie | bar | rose | scatter
Related Examples
•
“Access Data Using Categorical Arrays” on page 8-24
Plot Categorical Data
8-15