

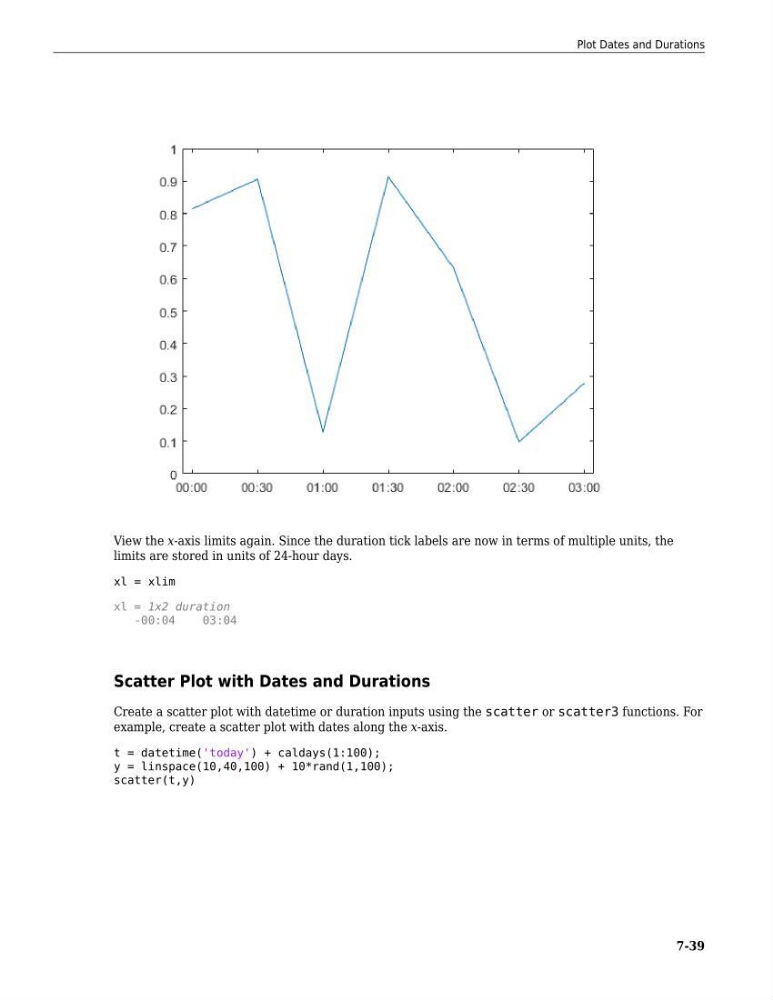
View the x-axis limits again. Since the duration tick labels are now in terms of multiple units, the
limits are stored in units of 24-hour days.
xl = xlim
xl = 1x2 duration
-00:04
03:04
Scatter Plot with Dates and Durations
Create a scatter plot with datetime or duration inputs using the scatter or scatter3 functions. For
example, create a scatter plot with dates along the x-axis.
t = datetime('today') + caldays(1:100);
y = linspace(10,40,100) + 10*rand(1,100);
scatter(t,y)
Plot Dates and Durations
7-39
limits are stored in units of 24-hour days.
xl = xlim
xl = 1x2 duration
-00:04
03:04
Scatter Plot with Dates and Durations
Create a scatter plot with datetime or duration inputs using the scatter or scatter3 functions. For
example, create a scatter plot with dates along the x-axis.
t = datetime('today') + caldays(1:100);
y = linspace(10,40,100) + 10*rand(1,100);
scatter(t,y)
Plot Dates and Durations
7-39