

Plot Dates and Durations
You can create plots of datetime and duration values with a variety of graphics functions. You also can
customize the axes, such as changing the format of the tick labels or changing the axis limits.
Line Plot with Dates
Create a line plot with datetime values on the x-axis. Then, change the format of the tick labels and
the x-axis limits.
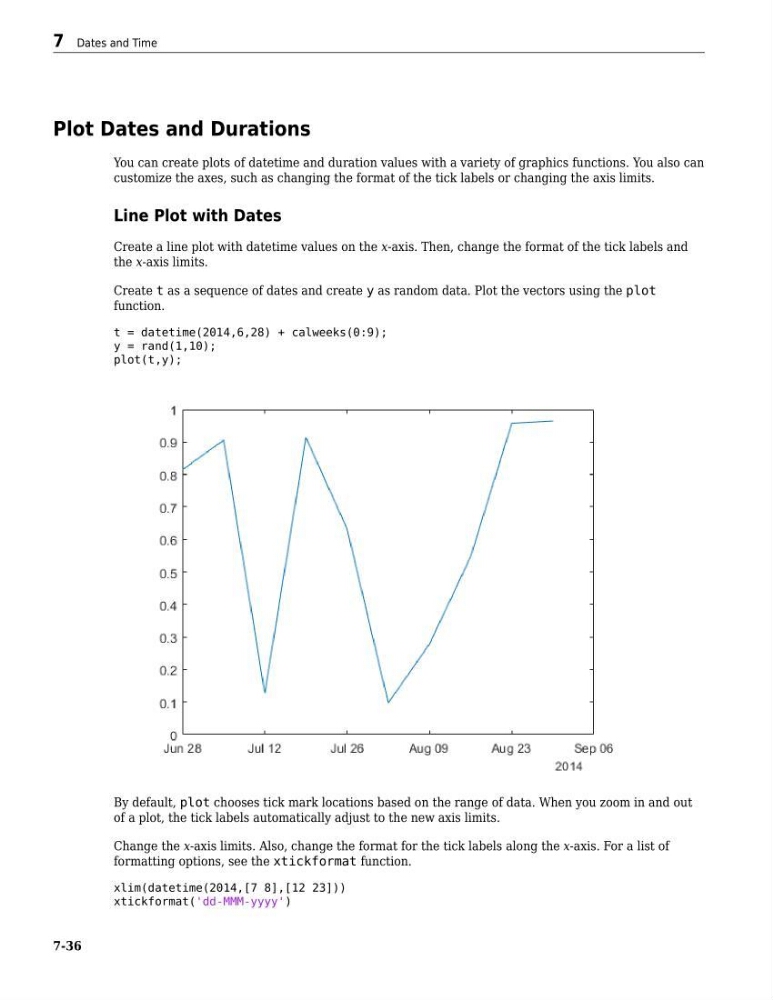
Create t as a sequence of dates and create y as random data. Plot the vectors using the plot
function.
t = datetime(2014,6,28) + calweeks(0:9);
y = rand(1,10);
plot(t,y);
By default, plot chooses tick mark locations based on the range of data. When you zoom in and out
of a plot, the tick labels automatically adjust to the new axis limits.
Change the x-axis limits. Also, change the format for the tick labels along the x-axis. For a list of
formatting options, see the xtickformat function.
xlim(datetime(2014,[7 8],[12 23]))
xtickformat('dd-MMM-yyyy')
7 Dates and Time
7-36
You can create plots of datetime and duration values with a variety of graphics functions. You also can
customize the axes, such as changing the format of the tick labels or changing the axis limits.
Line Plot with Dates
Create a line plot with datetime values on the x-axis. Then, change the format of the tick labels and
the x-axis limits.
Create t as a sequence of dates and create y as random data. Plot the vectors using the plot
function.
t = datetime(2014,6,28) + calweeks(0:9);
y = rand(1,10);
plot(t,y);
By default, plot chooses tick mark locations based on the range of data. When you zoom in and out
of a plot, the tick labels automatically adjust to the new axis limits.
Change the x-axis limits. Also, change the format for the tick labels along the x-axis. For a list of
formatting options, see the xtickformat function.
xlim(datetime(2014,[7 8],[12 23]))
xtickformat('dd-MMM-yyyy')
7 Dates and Time
7-36