

652 Higher Engineering Mathematics
i.e.
f (x) =
8
π
sin x +
1
3
sin 3x +
1
5
sin 5x
+
1
7
sin 7x +· · ·
Hence,
f (x) =
∞
n=−∞
−j
2
nπ
(1 −cos n π) e
jnx
≡
8
π
sinx +
1
3
sin 3x +
1
5
sin 5x
+
1
7
sin7x +· · ·
Now try the following exercise
Exercise 237 Further problems on
symmetry relationships
1. Determine the exponential form of the Fourier
series for the periodic function defined by:
f (x) =
⎧
⎪ ⎪ ⎪ ⎪ ⎪ ⎪ ⎨
⎪ ⎪ ⎪ ⎪ ⎪ ⎪ ⎩
−2, when −π ≤ x ≤ −
π
2
2, when −
π
2
≤ x ≤ +
π
2
−2, when +
π
2
≤ x ≤ + π
and has a period of 2π.
f (x) =
∞
n=−∞
4
nπ
sin
nπ
2
e
jnx
2 Show that the exponential form of the Fourier
series in problem 1 above is equivalent to:
f (x) =
8
π
cos x −
1
3
cos 3x +
1
5
cos5x
−
1
7
cos 7x + · · ·
3. Determine the complex Fourier series to represent the function f (t ) = 2t in the range −π
to +π.
f (t ) =
∞
n=−∞
j 2
n
cos nπ
e
jnt
4. Show that the complex Fourier series in
problem 3 above is equivalent to:
f (t ) = 4
sin t −
1
2
sin 2t +
1
3
sin 3t
−
1
4
sin 4t + · · ·
71.5 The frequency spectrum
In the Fourier analysis of periodic waveforms seen in
previous chapters, although waveforms physically exist
in the time domain, they can be regarded as comprising
components with a variety of frequencies. The amplitude and phase of these components are obtained from
the Fourier coefficients a n and b n ; this is known as a
frequency domain. Plots of amplitude/frequency and
phase/frequency are together known as the spectrum
of a waveform. A simple example is demonstrated in
Problem 6 following.
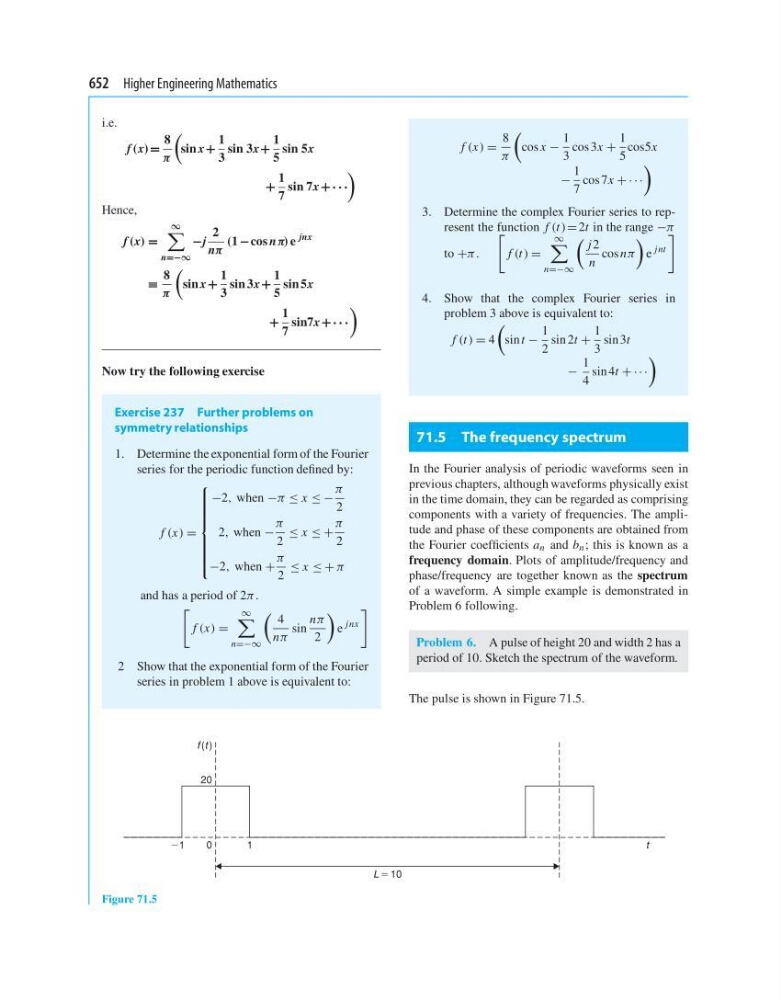
Problem 6. A pulse of height 20 and width 2 has a
period of 10. Sketch the spectrum of the waveform.
The pulse is shown in Figure 71.5.
L 5 10
f (t )
t
1
21
20
0
Figure 71.5