

578 Higher Engineering Mathematics
x
A
C
D
B
y
300
250
200
150
100
100 200 300
Frequency in hertz
Inductive reactance in ohms
400 500
50
0
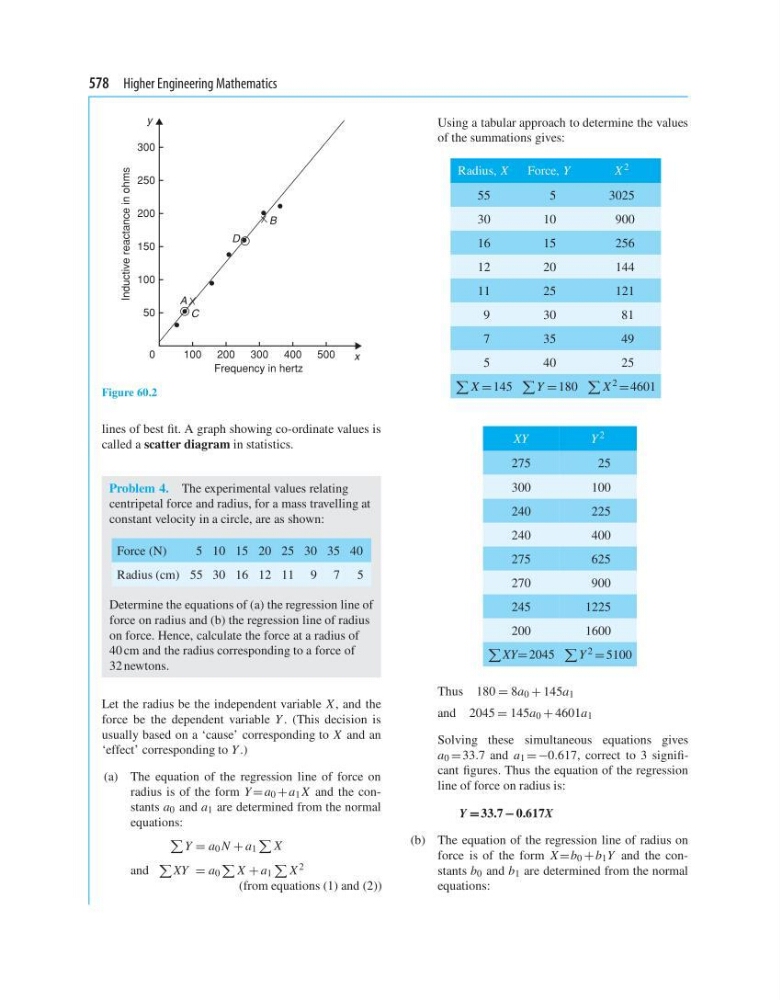
Figure 60.2
lines of best fit. A graph showing co-ordinate values is
called a scatter diagram in statistics.
Problem 4. The experimental values relating
centripetal force and radius, for a mass travelling at
constant velocity in a circle, are as shown:
Force (N)
5 10 15 20 25 30 35 40
Radius (cm) 55 30 16 12 11 9 7 5
Determine the equations of (a) the regression line of
force on radius and (b) the regression line of radius
on force. Hence, calculate the force at a radius of
40 cm and the radius corresponding to a force of
32 newtons.
Let the radius be the independent variable X , and the
force be the dependent variable Y . (This decision is
usually based on a ‘cause’ corresponding to X and an
‘effect’ corresponding to Y .)
(a) The equation of the regression line of force on
radius is of the form Y = a 0 + a 1 X and the constants a 0 and a 1 are determined from the normal
equations:
Y = a 0 N + a 1
X
and
XY = a 0
X + a 1
X 2
(from equations (1) and (2))
Using a tabular approach to determine the values
of the summations gives:
Radius, X
Force, Y
X 2
55
5
3025
30
10
900
16
15
256
12
20
144
11
25
121
9
30
81
7
35
49
5
40
25
X = 145
Y = 180
X 2 = 4601
XY
Y 2
275
25
300
100
240
225
240
400
275
625
270
900
245
1225
200
1600
XY= 2045
Y 2 = 5100
Thus 180 = 8a 0 + 145a 1
and 2045 = 145a 0 + 4601a 1
Solving these simultaneous equations gives
a 0 = 33.7 and a 1 =−0.617, correct to 3 significant figures. Thus the equation of the regression
line of force on radius is:
Y = 33.7 − 0.617X
(b) The equation of the regression line of radius on
force is of the form X =b 0 + b 1 Y and the constants b 0 and b 1 are determined from the normal
equations:
x
A
C
D
B
y
300
250
200
150
100
100 200 300
Frequency in hertz
Inductive reactance in ohms
400 500
50
0
Figure 60.2
lines of best fit. A graph showing co-ordinate values is
called a scatter diagram in statistics.
Problem 4. The experimental values relating
centripetal force and radius, for a mass travelling at
constant velocity in a circle, are as shown:
Force (N)
5 10 15 20 25 30 35 40
Radius (cm) 55 30 16 12 11 9 7 5
Determine the equations of (a) the regression line of
force on radius and (b) the regression line of radius
on force. Hence, calculate the force at a radius of
40 cm and the radius corresponding to a force of
32 newtons.
Let the radius be the independent variable X , and the
force be the dependent variable Y . (This decision is
usually based on a ‘cause’ corresponding to X and an
‘effect’ corresponding to Y .)
(a) The equation of the regression line of force on
radius is of the form Y = a 0 + a 1 X and the constants a 0 and a 1 are determined from the normal
equations:
Y = a 0 N + a 1
X
and
XY = a 0
X + a 1
X 2
(from equations (1) and (2))
Using a tabular approach to determine the values
of the summations gives:
Radius, X
Force, Y
X 2
55
5
3025
30
10
900
16
15
256
12
20
144
11
25
121
9
30
81
7
35
49
5
40
25
X = 145
Y = 180
X 2 = 4601
XY
Y 2
275
25
300
100
240
225
240
400
275
625
270
900
245
1225
200
1600
XY= 2045
Y 2 = 5100
Thus 180 = 8a 0 + 145a 1
and 2045 = 145a 0 + 4601a 1
Solving these simultaneous equations gives
a 0 = 33.7 and a 1 =−0.617, correct to 3 significant figures. Thus the equation of the regression
line of force on radius is:
Y = 33.7 − 0.617X
(b) The equation of the regression line of radius on
force is of the form X =b 0 + b 1 Y and the constants b 0 and b 1 are determined from the normal
equations: