

572 Higher Engineering Mathematics
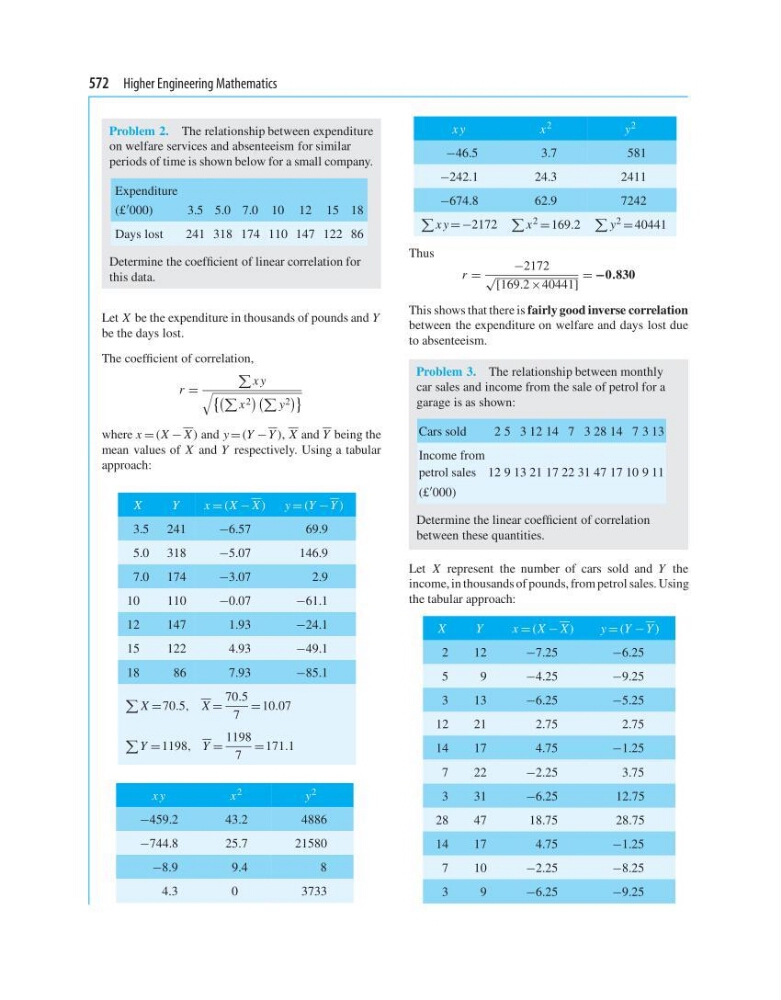
Problem 2. The relationship between expenditure
on welfare services and absenteeism for similar
periods of time is shown below for a small company.
Expenditure
(£ 000)
3.5 5.0 7.0 10 12 15 18
Days lost
241 318 174 110 147 122 86
Determine the coefficient of linear correlation for
this data.
Let X be the expenditure in thousands of pounds and Y
be the days lost.
The coefficient of correlation,
r =
x y
x 2
y 2
where x = (X − X ) and y = (Y − Y ), X and Y being the
mean values of X and Y respectively. Using a tabular
approach:
X
Y
x = (X − X ) y = (Y − Y )
3.5 241
−6.57
69.9
5.0 318
−5.07
146.9
7.0 174
−3.07
2.9
10
110
−0.07
−61.1
12
147
1.93
−24.1
15
122
4.93
−49.1
18
86
7.93
−85.1
X =70.5, X =
70.5
7
= 10.07
Y = 1198, Y =
1198
7
= 171.1
x y
x 2
y 2
−459.2
43.2
4886
−744.8
25.7
21580
−8.9
9.4
8
4.3
0
3733
x y
x 2
y 2
−46.5
3.7
581
−242.1
24.3
2411
−674.8
62.9
7242
x y =−2172
x 2 = 169.2
y 2 = 40441
Thus
r =
−2172
√
[169.2 ×40441]
= −0.830
This shows that there is fairly good inverse correlation
between the expenditure on welfare and days lost due
to absenteeism.
Problem 3. The relationship between monthly
car sales and income from the sale of petrol for a
garage is as shown:
Cars sold
2 5 3 12 14 7 3 28 14 7 3 13
Income from
petrol sales 12 9 13 21 17 22 31 47 17 10 9 11
(£ 000)
Determine the linear coefficient of correlation
between these quantities.
Let X represent the number of cars sold and Y the
income, in thousands of pounds, from petrol sales. Using
the tabular approach:
X
Y
x = (X − X)
y = (Y − Y )
2
12
−7.25
−6.25
5
9
−4.25
−9.25
3
13
−6.25
−5.25
12
21
2.75
2.75
14
17
4.75
−1.25
7
22
−2.25
3.75
3
31
−6.25
12.75
28
47
18.75
28.75
14
17
4.75
−1.25
7
10
−2.25
−8.25
3
9
−6.25
−9.25
Problem 2. The relationship between expenditure
on welfare services and absenteeism for similar
periods of time is shown below for a small company.
Expenditure
(£ 000)
3.5 5.0 7.0 10 12 15 18
Days lost
241 318 174 110 147 122 86
Determine the coefficient of linear correlation for
this data.
Let X be the expenditure in thousands of pounds and Y
be the days lost.
The coefficient of correlation,
r =
x y
x 2
y 2
where x = (X − X ) and y = (Y − Y ), X and Y being the
mean values of X and Y respectively. Using a tabular
approach:
X
Y
x = (X − X ) y = (Y − Y )
3.5 241
−6.57
69.9
5.0 318
−5.07
146.9
7.0 174
−3.07
2.9
10
110
−0.07
−61.1
12
147
1.93
−24.1
15
122
4.93
−49.1
18
86
7.93
−85.1
X =70.5, X =
70.5
7
= 10.07
Y = 1198, Y =
1198
7
= 171.1
x y
x 2
y 2
−459.2
43.2
4886
−744.8
25.7
21580
−8.9
9.4
8
4.3
0
3733
x y
x 2
y 2
−46.5
3.7
581
−242.1
24.3
2411
−674.8
62.9
7242
x y =−2172
x 2 = 169.2
y 2 = 40441
Thus
r =
−2172
√
[169.2 ×40441]
= −0.830
This shows that there is fairly good inverse correlation
between the expenditure on welfare and days lost due
to absenteeism.
Problem 3. The relationship between monthly
car sales and income from the sale of petrol for a
garage is as shown:
Cars sold
2 5 3 12 14 7 3 28 14 7 3 13
Income from
petrol sales 12 9 13 21 17 22 31 47 17 10 9 11
(£ 000)
Determine the linear coefficient of correlation
between these quantities.
Let X represent the number of cars sold and Y the
income, in thousands of pounds, from petrol sales. Using
the tabular approach:
X
Y
x = (X − X)
y = (Y − Y )
2
12
−7.25
−6.25
5
9
−4.25
−9.25
3
13
−6.25
−5.25
12
21
2.75
2.75
14
17
4.75
−1.25
7
22
−2.25
3.75
3
31
−6.25
12.75
28
47
18.75
28.75
14
17
4.75
−1.25
7
10
−2.25
−8.25
3
9
−6.25
−9.25