

558 Higher Engineering Mathematics
(b) To determine the probability that more than
two bolts are defective, the sum of the probabilities of 3 bolts, 4 bolts, 5 bolts, 6 bolts and 7 bolts
being defective can be determined. An easier way
to find this sum is to find 1 − (sum of 0 bolts, 1 bolt
and 2 bolts being defective), since the sum of all
the terms is unity. Thus, the probability of there
being more than two bolts outside of the tolerance
values is:
1 − (0.6983 + 0.2573 + 0.0406), i.e. 0.0038
Problem 4. A package contains 50 similar
components and inspection shows that four
have been damaged during transit. If six
components are drawn at random from the contents
of the package determine the probabilities that in
this sample (a) one and (b) less than three are
damaged.
The probability of a component being damaged, p,
is 4 in 50, i.e. 0.08 per unit. Thus, the probability of a
component not being damaged, q, is 1 − 0.08, i.e. 0.92.
The probability of there being 0, 1, 2, ..., 6 damaged
components is given by the successive terms of
(q + p) 6 , taken from left to right.
(q + p)
6
= q
6
+ 6q
5 p + 15q
4 p
2
+ 20q
3 p
3
+ · · ·
(a) The probability of one damaged component is
6q
5 p = 6 × 0.92
5
× 0.08 = 0.3164
(b) The probability of less than three damaged components is given by the sum of the probabilities of
0, 1 and 2 damaged components.
q
6
+ 6q
5 p + 15q
4 p
2
= 0.92
6
+ 6 × 0.92
5
× 0.08
+ 15 × 0.92
4
× 0.08
2
= 0.6064 + 0.3164 + 0.0688 = 0.9916
Histogram of probabilities
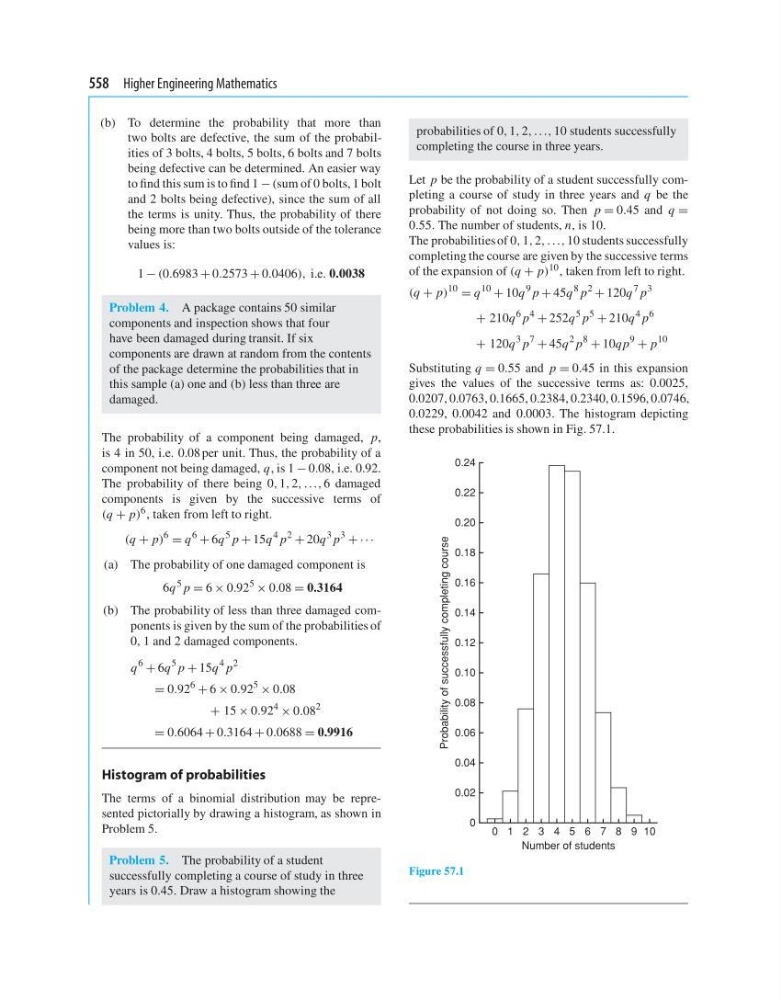
The terms of a binomial distribution may be represented pictorially by drawing a histogram, as shown in
Problem 5.
Problem 5. The probability of a student
successfully completing a course of study in three
years is 0.45. Draw a histogram showing the
probabilities of 0, 1, 2, ..., 10 students successfully
completing the course in three years.
Let p be the probability of a student successfully completing a course of study in three years and q be the
probability of not doing so. Then p = 0.45 and q =
0.55. The number of students, n, is 10.
The probabilities of 0, 1, 2, ..., 10 students successfully
completing the course are given by the successive terms
of the expansion of (q + p) 10 , taken from left to right.
(q + p)
10
= q
10
+ 10q
9 p + 45q
8 p
2
+ 120q
7 p
3
+ 210q
6 p
4
+ 252q
5 p
5
+ 210q
4 p
6
+ 120q
3 p
7
+ 45q
2 p
8
+ 10qp
9
+ p
10
Substituting q = 0.55 and p = 0.45 in this expansion
gives the values of the successive terms as: 0.0025,
0.0207, 0.0763, 0.1665, 0.2384, 0.2340, 0.1596, 0.0746,
0.0229, 0.0042 and 0.0003. The histogram depicting
these probabilities is shown in Fig. 57.1.
0.24
0.22
0.20
0.18
0.16
0.14
0.12
Probability of successfully completing course
0.10
0.08
0.06
0.04
0.02
0
0 1 2 3 4 5
Number of students
6 7 8 9 10
Figure 57.1
(b) To determine the probability that more than
two bolts are defective, the sum of the probabilities of 3 bolts, 4 bolts, 5 bolts, 6 bolts and 7 bolts
being defective can be determined. An easier way
to find this sum is to find 1 − (sum of 0 bolts, 1 bolt
and 2 bolts being defective), since the sum of all
the terms is unity. Thus, the probability of there
being more than two bolts outside of the tolerance
values is:
1 − (0.6983 + 0.2573 + 0.0406), i.e. 0.0038
Problem 4. A package contains 50 similar
components and inspection shows that four
have been damaged during transit. If six
components are drawn at random from the contents
of the package determine the probabilities that in
this sample (a) one and (b) less than three are
damaged.
The probability of a component being damaged, p,
is 4 in 50, i.e. 0.08 per unit. Thus, the probability of a
component not being damaged, q, is 1 − 0.08, i.e. 0.92.
The probability of there being 0, 1, 2, ..., 6 damaged
components is given by the successive terms of
(q + p) 6 , taken from left to right.
(q + p)
6
= q
6
+ 6q
5 p + 15q
4 p
2
+ 20q
3 p
3
+ · · ·
(a) The probability of one damaged component is
6q
5 p = 6 × 0.92
5
× 0.08 = 0.3164
(b) The probability of less than three damaged components is given by the sum of the probabilities of
0, 1 and 2 damaged components.
q
6
+ 6q
5 p + 15q
4 p
2
= 0.92
6
+ 6 × 0.92
5
× 0.08
+ 15 × 0.92
4
× 0.08
2
= 0.6064 + 0.3164 + 0.0688 = 0.9916
Histogram of probabilities
The terms of a binomial distribution may be represented pictorially by drawing a histogram, as shown in
Problem 5.
Problem 5. The probability of a student
successfully completing a course of study in three
years is 0.45. Draw a histogram showing the
probabilities of 0, 1, 2, ..., 10 students successfully
completing the course in three years.
Let p be the probability of a student successfully completing a course of study in three years and q be the
probability of not doing so. Then p = 0.45 and q =
0.55. The number of students, n, is 10.
The probabilities of 0, 1, 2, ..., 10 students successfully
completing the course are given by the successive terms
of the expansion of (q + p) 10 , taken from left to right.
(q + p)
10
= q
10
+ 10q
9 p + 45q
8 p
2
+ 120q
7 p
3
+ 210q
6 p
4
+ 252q
5 p
5
+ 210q
4 p
6
+ 120q
3 p
7
+ 45q
2 p
8
+ 10qp
9
+ p
10
Substituting q = 0.55 and p = 0.45 in this expansion
gives the values of the successive terms as: 0.0025,
0.0207, 0.0763, 0.1665, 0.2384, 0.2340, 0.1596, 0.0746,
0.0229, 0.0042 and 0.0003. The histogram depicting
these probabilities is shown in Fig. 57.1.
0.24
0.22
0.20
0.18
0.16
0.14
0.12
Probability of successfully completing course
0.10
0.08
0.06
0.04
0.02
0
0 1 2 3 4 5
Number of students
6 7 8 9 10
Figure 57.1