

Measures of central tendency and dispersion 543
where f is the class frequency and x is the class midpoint value. Hence mean value,
x =
(3 × 20.7) + (10 × 21.2) + (11 × 21.7)
+ (13 × 22.2) + (9 × 22.7) + (2 × 23.2)
48
=
1052.1
48
= 21.919.
i.e. the mean value is 21.9 ohms, correct to 3 significant
figures.
Histogram
The mean, median and modal values for grouped data
may be determined from a histogram. In a histogram,
frequency values are represented vertically and variable values horizontally. The mean value is given by
the value of the variable corresponding to a vertical
line drawn through the centroid of the histogram. The
median value is obtained by selecting a variable value
such that the area of the histogram to the left of a vertical
line drawn through the selected variable value is equal
to the area of the histogram on the right of the line. The
modal value is the variable value obtained by dividing
the width of the highest rectangle in the histogram in
proportion to the heights of the adjacent rectangles. The
method of determining the mean, median and modal
values from a histogram is shown in Problem 4.
Problem 4. The time taken in minutes to
assemble a device is measured 50 times and the
results are as shown. Draw a histogram depicting
this data and hence determine the mean, median
and modal values of the distribution.
14.5–15.5 5, 16.5–17.5 8,
18.5–19.5 16, 20.5–21.5 12,
22.5–23.5 6, 24.5–25.5 3
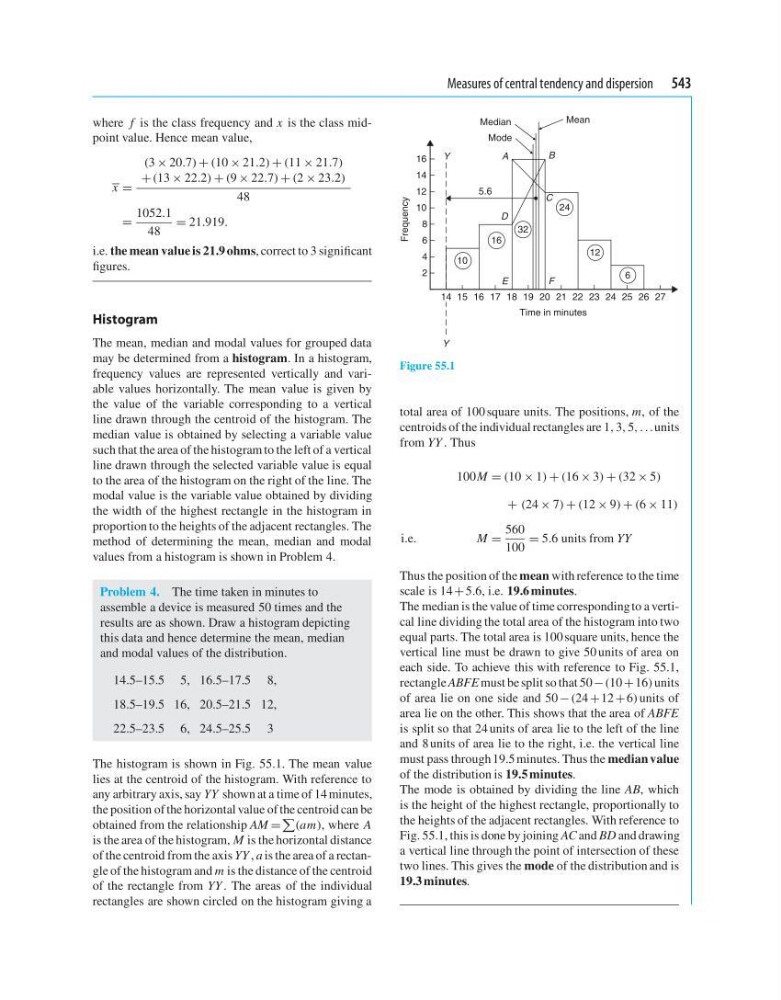
The histogram is shown in Fig. 55.1. The mean value
lies at the centroid of the histogram. With reference to
any arbitrary axis, say YY shown at a time of 14 minutes,
the position of the horizontal value of the centroid can be
obtained from the relationship AM =
(am), where A
is the area of the histogram, M is the horizontal distance
of the centroid from the axis YY , a is the area of a rectangle of the histogram and m is the distance of the centroid
of the rectangle from YY . The areas of the individual
rectangles are shown circled on the histogram giving a
14 15 16 17 18 19 20 21 22 23 24 25
6
26 27
4
2
6
Frequency
10
8
12
16
14
Time in minutes
12
24
32
16
10
E
D
A
Y
Y
5.6
Mode
Median
Mean
F
C
B
Figure 55.1
total area of 100 square units. The positions, m, of the
centroids of the individual rectangles are 1, 3, 5, ...units
from YY . Thus
100M = (10 × 1) + (16 × 3) + (32 × 5)
+ (24 × 7) + (12 × 9) + (6 × 11)
i.e.
M =
560
100
= 5.6 units from YY
Thus the position of the mean with reference to the time
scale is 14 + 5.6, i.e. 19.6 minutes.
The median is the value of time corresponding to a vertical line dividing the total area of the histogram into two
equal parts. The total area is 100 square units, hence the
vertical line must be drawn to give 50 units of area on
each side. To achieve this with reference to Fig. 55.1,
rectangle ABFE must be split so that 50 −(10 + 16) units
of area lie on one side and 50 − (24 +12 + 6) units of
area lie on the other. This shows that the area of ABFE
is split so that 24 units of area lie to the left of the line
and 8 units of area lie to the right, i.e. the vertical line
must pass through 19.5 minutes. Thus the median value
of the distribution is 19.5 minutes.
The mode is obtained by dividing the line AB, which
is the height of the highest rectangle, proportionally to
the heights of the adjacent rectangles. With reference to
Fig. 55.1, this is done by joining AC and BD and drawing
a vertical line through the point of intersection of these
two lines. This gives the mode of the distribution and is
19.3 minutes.
where f is the class frequency and x is the class midpoint value. Hence mean value,
x =
(3 × 20.7) + (10 × 21.2) + (11 × 21.7)
+ (13 × 22.2) + (9 × 22.7) + (2 × 23.2)
48
=
1052.1
48
= 21.919.
i.e. the mean value is 21.9 ohms, correct to 3 significant
figures.
Histogram
The mean, median and modal values for grouped data
may be determined from a histogram. In a histogram,
frequency values are represented vertically and variable values horizontally. The mean value is given by
the value of the variable corresponding to a vertical
line drawn through the centroid of the histogram. The
median value is obtained by selecting a variable value
such that the area of the histogram to the left of a vertical
line drawn through the selected variable value is equal
to the area of the histogram on the right of the line. The
modal value is the variable value obtained by dividing
the width of the highest rectangle in the histogram in
proportion to the heights of the adjacent rectangles. The
method of determining the mean, median and modal
values from a histogram is shown in Problem 4.
Problem 4. The time taken in minutes to
assemble a device is measured 50 times and the
results are as shown. Draw a histogram depicting
this data and hence determine the mean, median
and modal values of the distribution.
14.5–15.5 5, 16.5–17.5 8,
18.5–19.5 16, 20.5–21.5 12,
22.5–23.5 6, 24.5–25.5 3
The histogram is shown in Fig. 55.1. The mean value
lies at the centroid of the histogram. With reference to
any arbitrary axis, say YY shown at a time of 14 minutes,
the position of the horizontal value of the centroid can be
obtained from the relationship AM =
(am), where A
is the area of the histogram, M is the horizontal distance
of the centroid from the axis YY , a is the area of a rectangle of the histogram and m is the distance of the centroid
of the rectangle from YY . The areas of the individual
rectangles are shown circled on the histogram giving a
14 15 16 17 18 19 20 21 22 23 24 25
6
26 27
4
2
6
Frequency
10
8
12
16
14
Time in minutes
12
24
32
16
10
E
D
A
Y
Y
5.6
Mode
Median
Mean
F
C
B
Figure 55.1
total area of 100 square units. The positions, m, of the
centroids of the individual rectangles are 1, 3, 5, ...units
from YY . Thus
100M = (10 × 1) + (16 × 3) + (32 × 5)
+ (24 × 7) + (12 × 9) + (6 × 11)
i.e.
M =
560
100
= 5.6 units from YY
Thus the position of the mean with reference to the time
scale is 14 + 5.6, i.e. 19.6 minutes.
The median is the value of time corresponding to a vertical line dividing the total area of the histogram into two
equal parts. The total area is 100 square units, hence the
vertical line must be drawn to give 50 units of area on
each side. To achieve this with reference to Fig. 55.1,
rectangle ABFE must be split so that 50 −(10 + 16) units
of area lie on one side and 50 − (24 +12 + 6) units of
area lie on the other. This shows that the area of ABFE
is split so that 24 units of area lie to the left of the line
and 8 units of area lie to the right, i.e. the vertical line
must pass through 19.5 minutes. Thus the median value
of the distribution is 19.5 minutes.
The mode is obtained by dividing the line AB, which
is the height of the highest rectangle, proportionally to
the heights of the adjacent rectangles. With reference to
Fig. 55.1, this is done by joining AC and BD and drawing
a vertical line through the point of intersection of these
two lines. This gives the mode of the distribution and is
19.3 minutes.