

Exponential functions 37
of friction between these two surfaces is
μ = 0.26. Determine the tension on the taut
side of the belt, T newtons, when tension
on the slack side T 0 = 22.7 newtons, given
that these quantities are related by the law
T = T 0 e μθ .Determine also the value of θ when
T = 28.0 newtons.
[30.4 N, 0.807 rad]
7. The instantaneous current i at time t is given
by: i = 10 e
−t
CR when a capacitor is being
charged. The capacitance C is 7 ×10 −6 farads
and the resistance R is 0.3 × 10 6 ohms. Determine:
(a) the instantaneous current when t is
2.5 seconds, and
(b) the time for the instantaneous current to
fall to 5 amperes
Sketch a curve of current against time from
t = 0 to t = 6 seconds.
[(a) 3.04 A (b) 1.46 s]
8. The amount of product x (in mol/cm 3 ) found in
a chemical reaction starting with 2.5 mol/cm 3
of reactant is given by x = 2.5(1 − e −4t ) where
t is the time, in minutes, to form product x. Plot
a graph at 30 second intervals up to 2.5 minutes
and determine x after 1 minute.
[2.45 mol/cm 3 ]
9. The current i flowing in a capacitor at time t
is given by:
i = 12.5(1 − e
−t
CR )
where resistance R is 30 kilohms and the
capacitance C is 20 micro-farads. Determine:
(a) the current flowing after 0.5 seconds, and
(b) the time for the current to reach
10 amperes.
[(a) 7.07 A (b) 0.966 s]
4.6 Reduction of exponential laws to
linear form
Frequently, the relationship between two variables, say
x and y, is not a linear one, i.e. when x is plotted against
y a curve results. In such cases the non-linear equation
may be modified to the linear form, y = mx + c, so that
the constants, and thus the law relating the variables can
be determined. This technique is called ‘determination
of law’.
Graph paper is available where the scale markings
along the horizontal and vertical axes are proportional
to the logarithms of the numbers. Such graph paper is
called log-log graph paper.
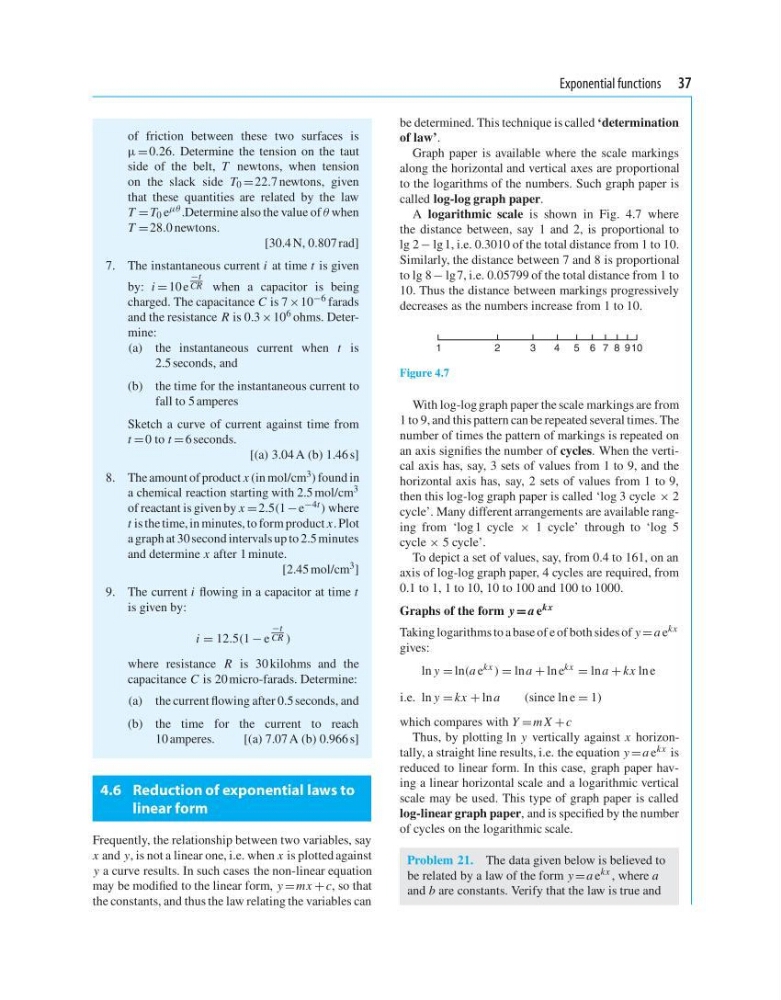
A logarithmic scale is shown in Fig. 4.7 where
the distance between, say 1 and 2, is proportional to
lg 2 − lg 1, i.e. 0.3010 of the total distance from 1 to 10.
Similarly, the distance between 7 and 8 is proportional
to lg 8 − lg 7, i.e. 0.05799 of the total distance from 1 to
10. Thus the distance between markings progressively
decreases as the numbers increase from 1 to 10.
1
2
3
4 5 6789 1 0
Figure 4.7
With log-log graph paper the scale markings are from
1 to 9, and this pattern can be repeated several times. The
number of times the pattern of markings is repeated on
an axis signifies the number of cycles. When the vertical axis has, say, 3 sets of values from 1 to 9, and the
horizontal axis has, say, 2 sets of values from 1 to 9,
then this log-log graph paper is called ‘log 3 cycle × 2
cycle’. Many different arrangements are available ranging from ‘log 1 cycle × 1 cycle’ through to ‘log 5
cycle × 5 cycle’.
To depict a set of values, say, from 0.4 to 161, on an
axis of log-log graph paper, 4 cycles are required, from
0.1 to 1, 1 to 10, 10 to 100 and 100 to 1000.
Graphs of the form y = a e kx
Taking logarithms to a base of e of both sides of y = a e kx
gives:
ln y = ln(a e kx ) = ln a + ln e kx = ln a + kx ln e
i.e. ln y = kx + ln a
(since ln e = 1)
which compares with Y = m X + c
Thus, by plotting ln y vertically against x horizontally, a straight line results, i.e. the equation y = a e kx is
reduced to linear form. In this case, graph paper having a linear horizontal scale and a logarithmic vertical
scale may be used. This type of graph paper is called
log-linear graph paper, and is specified by the number
of cycles on the logarithmic scale.
Problem 21. The data given below is believed to
be related by a law of the form y = a e
kx , where a
and b are constants. Verify that the law is true and
of friction between these two surfaces is
μ = 0.26. Determine the tension on the taut
side of the belt, T newtons, when tension
on the slack side T 0 = 22.7 newtons, given
that these quantities are related by the law
T = T 0 e μθ .Determine also the value of θ when
T = 28.0 newtons.
[30.4 N, 0.807 rad]
7. The instantaneous current i at time t is given
by: i = 10 e
−t
CR when a capacitor is being
charged. The capacitance C is 7 ×10 −6 farads
and the resistance R is 0.3 × 10 6 ohms. Determine:
(a) the instantaneous current when t is
2.5 seconds, and
(b) the time for the instantaneous current to
fall to 5 amperes
Sketch a curve of current against time from
t = 0 to t = 6 seconds.
[(a) 3.04 A (b) 1.46 s]
8. The amount of product x (in mol/cm 3 ) found in
a chemical reaction starting with 2.5 mol/cm 3
of reactant is given by x = 2.5(1 − e −4t ) where
t is the time, in minutes, to form product x. Plot
a graph at 30 second intervals up to 2.5 minutes
and determine x after 1 minute.
[2.45 mol/cm 3 ]
9. The current i flowing in a capacitor at time t
is given by:
i = 12.5(1 − e
−t
CR )
where resistance R is 30 kilohms and the
capacitance C is 20 micro-farads. Determine:
(a) the current flowing after 0.5 seconds, and
(b) the time for the current to reach
10 amperes.
[(a) 7.07 A (b) 0.966 s]
4.6 Reduction of exponential laws to
linear form
Frequently, the relationship between two variables, say
x and y, is not a linear one, i.e. when x is plotted against
y a curve results. In such cases the non-linear equation
may be modified to the linear form, y = mx + c, so that
the constants, and thus the law relating the variables can
be determined. This technique is called ‘determination
of law’.
Graph paper is available where the scale markings
along the horizontal and vertical axes are proportional
to the logarithms of the numbers. Such graph paper is
called log-log graph paper.
A logarithmic scale is shown in Fig. 4.7 where
the distance between, say 1 and 2, is proportional to
lg 2 − lg 1, i.e. 0.3010 of the total distance from 1 to 10.
Similarly, the distance between 7 and 8 is proportional
to lg 8 − lg 7, i.e. 0.05799 of the total distance from 1 to
10. Thus the distance between markings progressively
decreases as the numbers increase from 1 to 10.
1
2
3
4 5 6789 1 0
Figure 4.7
With log-log graph paper the scale markings are from
1 to 9, and this pattern can be repeated several times. The
number of times the pattern of markings is repeated on
an axis signifies the number of cycles. When the vertical axis has, say, 3 sets of values from 1 to 9, and the
horizontal axis has, say, 2 sets of values from 1 to 9,
then this log-log graph paper is called ‘log 3 cycle × 2
cycle’. Many different arrangements are available ranging from ‘log 1 cycle × 1 cycle’ through to ‘log 5
cycle × 5 cycle’.
To depict a set of values, say, from 0.4 to 161, on an
axis of log-log graph paper, 4 cycles are required, from
0.1 to 1, 1 to 10, 10 to 100 and 100 to 1000.
Graphs of the form y = a e kx
Taking logarithms to a base of e of both sides of y = a e kx
gives:
ln y = ln(a e kx ) = ln a + ln e kx = ln a + kx ln e
i.e. ln y = kx + ln a
(since ln e = 1)
which compares with Y = m X + c
Thus, by plotting ln y vertically against x horizontally, a straight line results, i.e. the equation y = a e kx is
reduced to linear form. In this case, graph paper having a linear horizontal scale and a logarithmic vertical
scale may be used. This type of graph paper is called
log-linear graph paper, and is specified by the number
of cycles on the logarithmic scale.
Problem 21. The data given below is believed to
be related by a law of the form y = a e
kx , where a
and b are constants. Verify that the law is true and