

532 Higher Engineering Mathematics
corresponding percentage values in the rows of the table
of percentages. The percentage component bar chart is
shown in Fig. 54.4.
1
10
20
Percentage relative frequency
30
40
50
60
70
80
90
100
2
3
Year
Key
6-roomed houses
5-roomed houses
4-roomed houses
5-roomed bungalows
4-roomed bungalows
Figure 54.4
Problem 6. The retail price of a product costing
£2 is made up as follows: materials 10 p, labour
20 p, research and development 40 p, overheads
70 p, profit 60 p. Present these data on a pie diagram.
A circle of any radius is drawn, and the area of the circle
represents the whole, which in this case is £2. The circle
is subdivided into sectors so that the areas of the sectors
are proportional to the parts, i.e. the parts which make
up the total retail price. For the area of a sector to be
proportional to a part, the angle at the centre of the circle
must be proportional to that part. The whole, £2 or 200 p,
corresponds to 360 ◦ . Therefore,
10 p corresponds to 360 ×
10
200
degrees, i.e. 18
◦
20 p corresponds to 360 ×
20
200
degrees, i.e. 36
◦
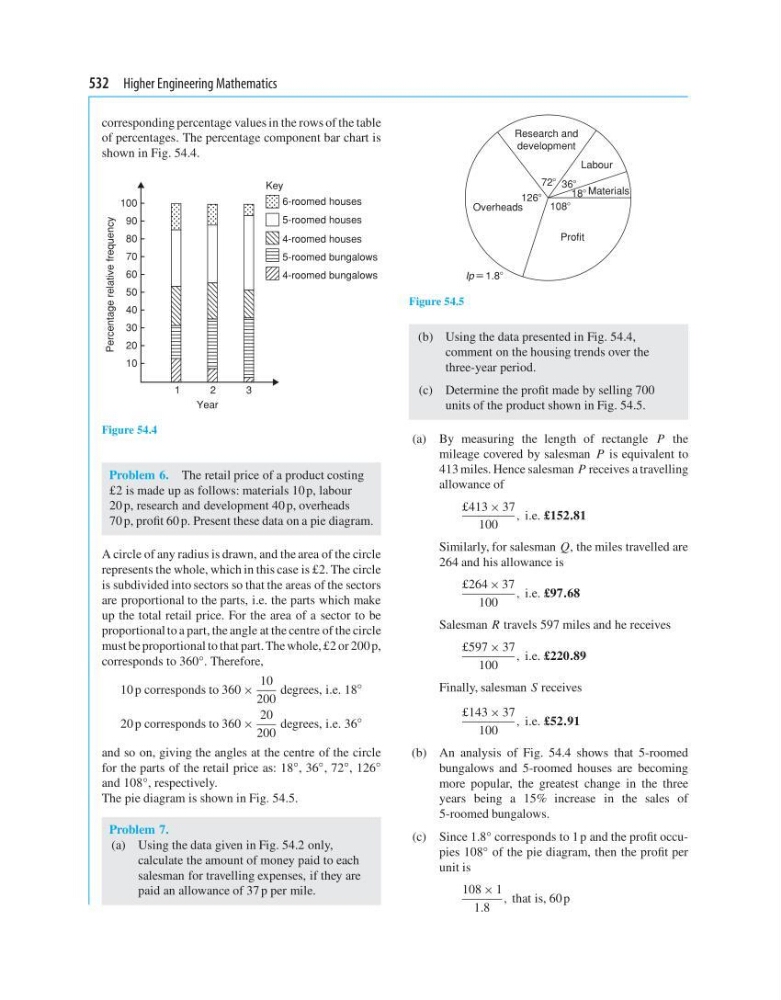
and so on, giving the angles at the centre of the circle
for the parts of the retail price as: 18
◦ , 36
◦ , 72
◦ , 126
◦
and 108 ◦ , respectively.
The pie diagram is shown in Fig. 54.5.
Problem 7.
(a) Using the data given in Fig. 54.2 only,
calculate the amount of money paid to each
salesman for travelling expenses, if they are
paid an allowance of 37 p per mile.
1088
Ip ϵ 1.88
188
368
728
1268
Overheads
Profit
Labour
Research and
development
Materials
Figure 54.5
(b) Using the data presented in Fig. 54.4,
comment on the housing trends over the
three-year period.
(c) Determine the profit made by selling 700
units of the product shown in Fig. 54.5.
(a) By measuring the length of rectangle P the
mileage covered by salesman P is equivalent to
413 miles. Hence salesman P receives a travelling
allowance of
£413 × 37
100
, i.e. £152.81
Similarly, for salesman Q, the miles travelled are
264 and his allowance is
£264 × 37
100
, i.e. £97.68
Salesman R travels 597 miles and he receives
£597 × 37
100
, i.e. £220.89
Finally, salesman S receives
£143 × 37
100
, i.e. £52.91
(b) An analysis of Fig. 54.4 shows that 5-roomed
bungalows and 5-roomed houses are becoming
more popular, the greatest change in the three
years being a 15% increase in the sales of
5-roomed bungalows.
(c) Since 1.8 ◦ corresponds to 1 p and the profit occupies 108 ◦ of the pie diagram, then the profit per
unit is
108 × 1
1.8
, that is, 60 p
corresponding percentage values in the rows of the table
of percentages. The percentage component bar chart is
shown in Fig. 54.4.
1
10
20
Percentage relative frequency
30
40
50
60
70
80
90
100
2
3
Year
Key
6-roomed houses
5-roomed houses
4-roomed houses
5-roomed bungalows
4-roomed bungalows
Figure 54.4
Problem 6. The retail price of a product costing
£2 is made up as follows: materials 10 p, labour
20 p, research and development 40 p, overheads
70 p, profit 60 p. Present these data on a pie diagram.
A circle of any radius is drawn, and the area of the circle
represents the whole, which in this case is £2. The circle
is subdivided into sectors so that the areas of the sectors
are proportional to the parts, i.e. the parts which make
up the total retail price. For the area of a sector to be
proportional to a part, the angle at the centre of the circle
must be proportional to that part. The whole, £2 or 200 p,
corresponds to 360 ◦ . Therefore,
10 p corresponds to 360 ×
10
200
degrees, i.e. 18
◦
20 p corresponds to 360 ×
20
200
degrees, i.e. 36
◦
and so on, giving the angles at the centre of the circle
for the parts of the retail price as: 18
◦ , 36
◦ , 72
◦ , 126
◦
and 108 ◦ , respectively.
The pie diagram is shown in Fig. 54.5.
Problem 7.
(a) Using the data given in Fig. 54.2 only,
calculate the amount of money paid to each
salesman for travelling expenses, if they are
paid an allowance of 37 p per mile.
1088
Ip ϵ 1.88
188
368
728
1268
Overheads
Profit
Labour
Research and
development
Materials
Figure 54.5
(b) Using the data presented in Fig. 54.4,
comment on the housing trends over the
three-year period.
(c) Determine the profit made by selling 700
units of the product shown in Fig. 54.5.
(a) By measuring the length of rectangle P the
mileage covered by salesman P is equivalent to
413 miles. Hence salesman P receives a travelling
allowance of
£413 × 37
100
, i.e. £152.81
Similarly, for salesman Q, the miles travelled are
264 and his allowance is
£264 × 37
100
, i.e. £97.68
Salesman R travels 597 miles and he receives
£597 × 37
100
, i.e. £220.89
Finally, salesman S receives
£143 × 37
100
, i.e. £52.91
(b) An analysis of Fig. 54.4 shows that 5-roomed
bungalows and 5-roomed houses are becoming
more popular, the greatest change in the three
years being a 15% increase in the sales of
5-roomed bungalows.
(c) Since 1.8 ◦ corresponds to 1 p and the profit occupies 108 ◦ of the pie diagram, then the profit per
unit is
108 × 1
1.8
, that is, 60 p