

208 Higher Engineering Mathematics
(b) Area under waveform (b) for a half
cycle = (1 × 1) + (3 × 2) = 7 As.
Average value of waveform
=
area under curve
length of base
=
7 As
3 s
= 2.33 A
(c) A half cycle of the voltage waveform (c) is
completed in 4 ms.
Area under curve =
1
2 {(3 − 1)10 −3 }(10)
= 10 × 10 −3 Vs
Average value of waveform
=
area under curve
length of base
=
10 × 10 −3 Vs
4 × 10 −3 s
= 2.5 V
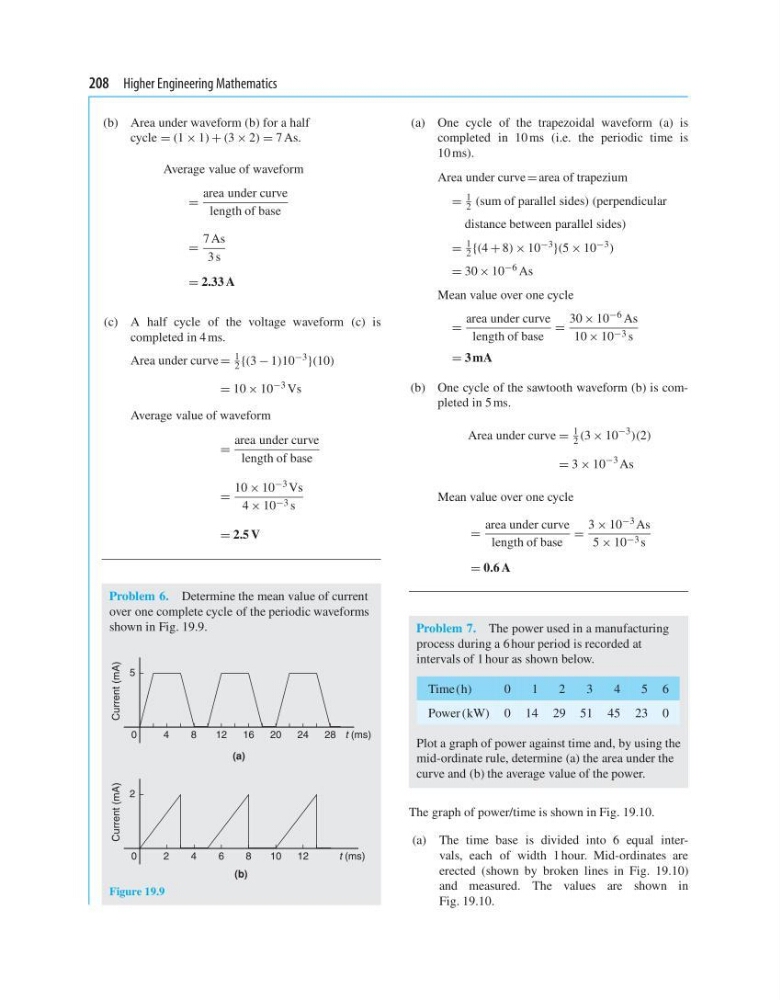
Problem 6. Determine the mean value of current
over one complete cycle of the periodic waveforms
shown in Fig. 19.9.
(a)
0
12
16
20
24
28
4
8
5
Current (mA)
t (ms)
(b)
0
6
8
1 0
1 2
2
4
2
Current (mA)
t (ms)
Figure 19.9
(a) One cycle of the trapezoidal waveform (a) is
completed in 10 ms (i.e. the periodic time is
10 ms).
Area under curve = area of trapezium
=
1
2 (sum of parallel sides) (perpendicular
distance between parallel sides)
=
1
2 {(4 + 8) × 10 −3 }(5 × 10 −3 )
= 30 × 10 −6 As
Mean value over one cycle
=
area under curve
length of base
=
30 × 10 −6 As
10 × 10 −3 s
= 3 mA
(b) One cycle of the sawtooth waveform (b) is completed in 5 ms.
Area under curve =
1
2 (3 × 10
−3
)(2)
= 3 × 10
−3 As
Mean value over one cycle
=
area under curve
length of base
=
3 × 10 −3 As
5 × 10 −3 s
= 0.6 A
Problem 7. The power used in a manufacturing
process during a 6 hour period is recorded at
intervals of 1 hour as shown below.
Time (h)
0
1
2
3
4
5 6
Power (kW) 0 14 29 51 45 23 0
Plot a graph of power against time and, by using the
mid-ordinate rule, determine (a) the area under the
curve and (b) the average value of the power.
The graph of power/time is shown in Fig. 19.10.
(a) The time base is divided into 6 equal intervals, each of width 1 hour. Mid-ordinates are
erected (shown by broken lines in Fig. 19.10)
and measured. The values are shown in
Fig. 19.10.
(b) Area under waveform (b) for a half
cycle = (1 × 1) + (3 × 2) = 7 As.
Average value of waveform
=
area under curve
length of base
=
7 As
3 s
= 2.33 A
(c) A half cycle of the voltage waveform (c) is
completed in 4 ms.
Area under curve =
1
2 {(3 − 1)10 −3 }(10)
= 10 × 10 −3 Vs
Average value of waveform
=
area under curve
length of base
=
10 × 10 −3 Vs
4 × 10 −3 s
= 2.5 V
Problem 6. Determine the mean value of current
over one complete cycle of the periodic waveforms
shown in Fig. 19.9.
(a)
0
12
16
20
24
28
4
8
5
Current (mA)
t (ms)
(b)
0
6
8
1 0
1 2
2
4
2
Current (mA)
t (ms)
Figure 19.9
(a) One cycle of the trapezoidal waveform (a) is
completed in 10 ms (i.e. the periodic time is
10 ms).
Area under curve = area of trapezium
=
1
2 (sum of parallel sides) (perpendicular
distance between parallel sides)
=
1
2 {(4 + 8) × 10 −3 }(5 × 10 −3 )
= 30 × 10 −6 As
Mean value over one cycle
=
area under curve
length of base
=
30 × 10 −6 As
10 × 10 −3 s
= 3 mA
(b) One cycle of the sawtooth waveform (b) is completed in 5 ms.
Area under curve =
1
2 (3 × 10
−3
)(2)
= 3 × 10
−3 As
Mean value over one cycle
=
area under curve
length of base
=
3 × 10 −3 As
5 × 10 −3 s
= 0.6 A
Problem 7. The power used in a manufacturing
process during a 6 hour period is recorded at
intervals of 1 hour as shown below.
Time (h)
0
1
2
3
4
5 6
Power (kW) 0 14 29 51 45 23 0
Plot a graph of power against time and, by using the
mid-ordinate rule, determine (a) the area under the
curve and (b) the average value of the power.
The graph of power/time is shown in Fig. 19.10.
(a) The time base is divided into 6 equal intervals, each of width 1 hour. Mid-ordinates are
erected (shown by broken lines in Fig. 19.10)
and measured. The values are shown in
Fig. 19.10.