

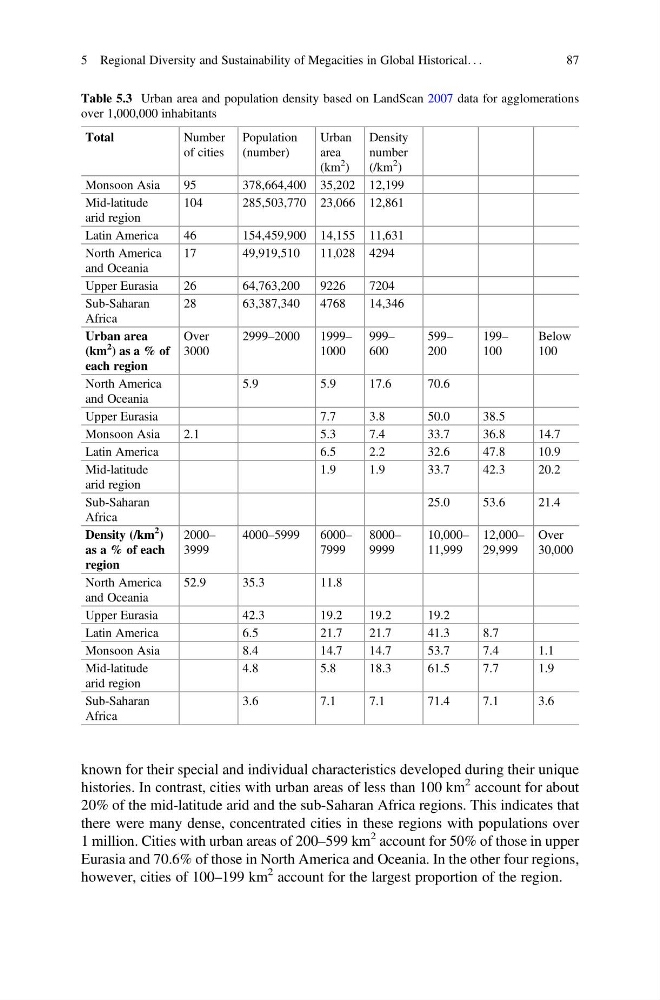
known for their special and individual characteristics developed during their unique
histories. In contrast, cities with urban areas of less than 100 km
2 account for about
20% of the mid-latitude arid and the sub-Saharan Africa regions. This indicates that
there were many dense, concentrated cities in these regions with populations over
1 million. Cities with urban areas of 200–599 km
2 account for 50% of those in upper
Eurasia and 70.6% of those in North America and Oceania. In the other four regions,
however, cities of 100–199 km
2 account for the largest proportion of the region.
Table 5.3 Urban area and population density based on LandScan 2007 data for agglomerations
over 1,000,000 inhabitants
Total
Number
of cities
Population
(number)
Urban
area
(km
2
)
Density
number
(/km
2
)
Monsoon Asia
95
378,664,400 35,202 12,199
Mid-latitude
arid region
104
285,503,770 23,066 12,861
Latin America
46
154,459,900 14,155 11,631
North America
and Oceania
17
49,919,510
11,028 4294
Upper Eurasia
26
64,763,200
9226
7204
Sub-Saharan
Africa
28
63,387,340
4768
14,346
Urban area
(km
2
) as a % of
each region
Over
3000
2999–2000
1999–
1000
999–
600
599–
200
199–
100
Below
100
North America
and Oceania
5.9
5.9
17.6
70.6
Upper Eurasia
7.7
3.8
50.0
38.5
Monsoon Asia
2.1
5.3
7.4
33.7
36.8
14.7
Latin America
6.5
2.2
32.6
47.8
10.9
Mid-latitude
arid region
1.9
1.9
33.7
42.3
20.2
Sub-Saharan
Africa
25.0
53.6
21.4
Density (/km
2
)
as a % of each
region
2000–
3999
4000–5999
6000–
7999
8000–
9999
10,000–
11,999
12,000–
29,999
Over
30,000
North America
and Oceania
52.9
35.3
11.8
Upper Eurasia
42.3
19.2
19.2
19.2
Latin America
6.5
21.7
21.7
41.3
8.7
Monsoon Asia
8.4
14.7
14.7
53.7
7.4
1.1
Mid-latitude
arid region
4.8
5.8
18.3
61.5
7.7
1.9
Sub-Saharan
Africa
3.6
7.1
7.1
71.4
7.1
3.6
5 Regional Diversity and Sustainability of Megacities in Global Historical. . .
87
histories. In contrast, cities with urban areas of less than 100 km
2 account for about
20% of the mid-latitude arid and the sub-Saharan Africa regions. This indicates that
there were many dense, concentrated cities in these regions with populations over
1 million. Cities with urban areas of 200–599 km
2 account for 50% of those in upper
Eurasia and 70.6% of those in North America and Oceania. In the other four regions,
however, cities of 100–199 km
2 account for the largest proportion of the region.
Table 5.3 Urban area and population density based on LandScan 2007 data for agglomerations
over 1,000,000 inhabitants
Total
Number
of cities
Population
(number)
Urban
area
(km
2
)
Density
number
(/km
2
)
Monsoon Asia
95
378,664,400 35,202 12,199
Mid-latitude
arid region
104
285,503,770 23,066 12,861
Latin America
46
154,459,900 14,155 11,631
North America
and Oceania
17
49,919,510
11,028 4294
Upper Eurasia
26
64,763,200
9226
7204
Sub-Saharan
Africa
28
63,387,340
4768
14,346
Urban area
(km
2
) as a % of
each region
Over
3000
2999–2000
1999–
1000
999–
600
599–
200
199–
100
Below
100
North America
and Oceania
5.9
5.9
17.6
70.6
Upper Eurasia
7.7
3.8
50.0
38.5
Monsoon Asia
2.1
5.3
7.4
33.7
36.8
14.7
Latin America
6.5
2.2
32.6
47.8
10.9
Mid-latitude
arid region
1.9
1.9
33.7
42.3
20.2
Sub-Saharan
Africa
25.0
53.6
21.4
Density (/km
2
)
as a % of each
region
2000–
3999
4000–5999
6000–
7999
8000–
9999
10,000–
11,999
12,000–
29,999
Over
30,000
North America
and Oceania
52.9
35.3
11.8
Upper Eurasia
42.3
19.2
19.2
19.2
Latin America
6.5
21.7
21.7
41.3
8.7
Monsoon Asia
8.4
14.7
14.7
53.7
7.4
1.1
Mid-latitude
arid region
4.8
5.8
18.3
61.5
7.7
1.9
Sub-Saharan
Africa
3.6
7.1
7.1
71.4
7.1
3.6
5 Regional Diversity and Sustainability of Megacities in Global Historical. . .
87