

V rural,n ¼ β f 1 Population density n þ β f 2 Complex dummy n þ β f 3 Soil dummy n
V regular,n ¼ β p1 þ β p2 Population density n þ β p3 Regular dummy n
V highrise,n ¼ β h1 þ β h2 Buildings n
where V k, n is the observed component of the utility if residential type k is realized in
mesh n.
Tables 4.3 and 4.4 and Fig. 4.6 show the results of classification validity
checking. Table 4.3 shows the relationship between the visual detection results
and the model prediction results, and Table 4.4 reveals the model estimation results.
Note that Table 4.4 shows all the explanatory variables used to estimate this model.
According to the results, the overall hit rate is 73%, and the separate hit rates are 76%
for the urban village type, 65% for the rural type, 78% for the regular form type, and
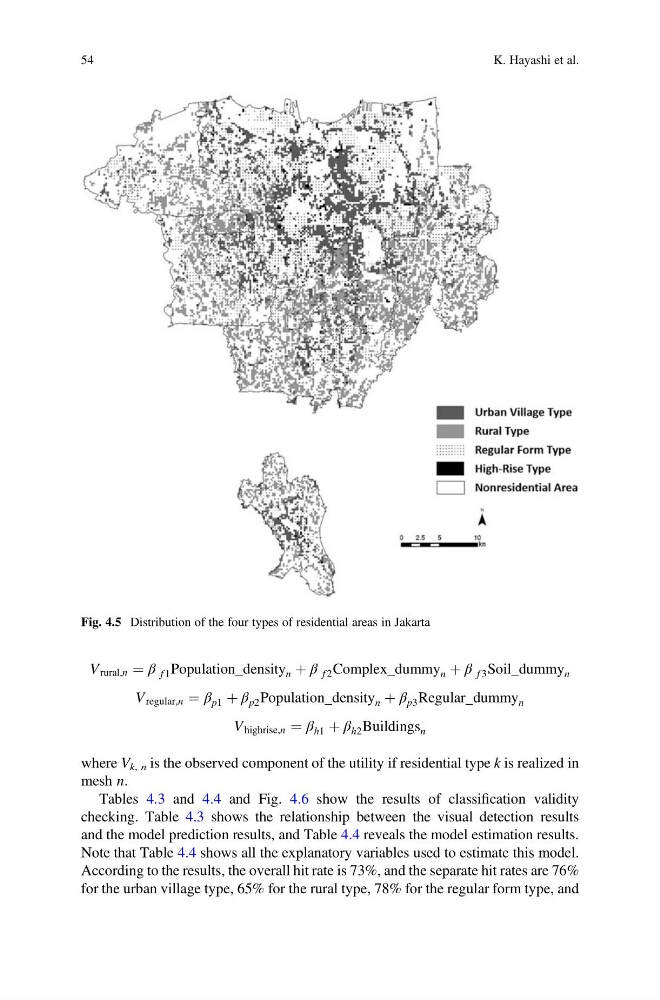
Fig. 4.5 Distribution of the four types of residential areas in Jakarta
54
K. Hayashi et al.
V regular,n ¼ β p1 þ β p2 Population density n þ β p3 Regular dummy n
V highrise,n ¼ β h1 þ β h2 Buildings n
where V k, n is the observed component of the utility if residential type k is realized in
mesh n.
Tables 4.3 and 4.4 and Fig. 4.6 show the results of classification validity
checking. Table 4.3 shows the relationship between the visual detection results
and the model prediction results, and Table 4.4 reveals the model estimation results.
Note that Table 4.4 shows all the explanatory variables used to estimate this model.
According to the results, the overall hit rate is 73%, and the separate hit rates are 76%
for the urban village type, 65% for the rural type, 78% for the regular form type, and
Fig. 4.5 Distribution of the four types of residential areas in Jakarta
54
K. Hayashi et al.