

dwelling units, is considered the basic unit of the residential area, and we propose to
classify each residential area into several types based on the physical features on the
neighborhood scale.
To be applied to any city, the indicators in the neighborhood scale must represent
physical features that can be visually discerned from satellite images. In emerging
and developing countries, it is currently difficult to obtain detailed data to classify the
residential form, such as the complete network of streets, a building’s height, and
other physical features. Therefore, visual detection is the simplest and most useful
method to classify the residential areas based on physical features. However, visual
detection has the disadvantage of causing fluctuations in the consistency of the
classification criteria. To overcome this limitation, we construct a multinomial
logit model that uses existing data to substitute for each indicator as an explanatory
variable to predict the result of visual detection, and then we evaluate the reliability
of the visual detection results based on the hit rate of the model prediction results to
the visual detection results.
4.2.2 Setting of Indicators
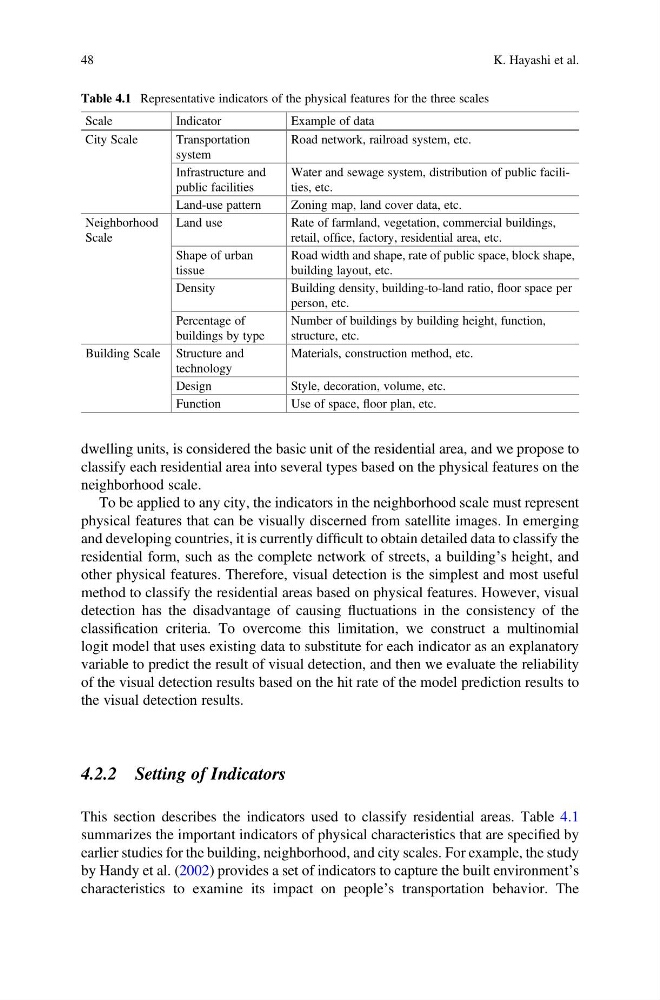
This section describes the indicators used to classify residential areas. Table 4.1
summarizes the important indicators of physical characteristics that are specified by
earlier studies for the building, neighborhood, and city scales. For example, the study
by Handy et al. (2002) provides a set of indicators to capture the built environment’s
characteristics to examine its impact on people’s transportation behavior. The
Table 4.1 Representative indicators of the physical features for the three scales
Scale
Indicator
Example of data
City Scale
Transportation
system
Road network, railroad system, etc.
Infrastructure and
public facilities
Water and sewage system, distribution of public facilities, etc.
Land-use pattern
Zoning map, land cover data, etc.
Neighborhood
Scale
Land use
Rate of farmland, vegetation, commercial buildings,
retail, office, factory, residential area, etc.
Shape of urban
tissue
Road width and shape, rate of public space, block shape,
building layout, etc.
Density
Building density, building-to-land ratio, floor space per
person, etc.
Percentage of
buildings by type
Number of buildings by building height, function,
structure, etc.
Building Scale Structure and
technology
Materials, construction method, etc.
Design
Style, decoration, volume, etc.
Function
Use of space, floor plan, etc.
48
K. Hayashi et al.
classify each residential area into several types based on the physical features on the
neighborhood scale.
To be applied to any city, the indicators in the neighborhood scale must represent
physical features that can be visually discerned from satellite images. In emerging
and developing countries, it is currently difficult to obtain detailed data to classify the
residential form, such as the complete network of streets, a building’s height, and
other physical features. Therefore, visual detection is the simplest and most useful
method to classify the residential areas based on physical features. However, visual
detection has the disadvantage of causing fluctuations in the consistency of the
classification criteria. To overcome this limitation, we construct a multinomial
logit model that uses existing data to substitute for each indicator as an explanatory
variable to predict the result of visual detection, and then we evaluate the reliability
of the visual detection results based on the hit rate of the model prediction results to
the visual detection results.
4.2.2 Setting of Indicators
This section describes the indicators used to classify residential areas. Table 4.1
summarizes the important indicators of physical characteristics that are specified by
earlier studies for the building, neighborhood, and city scales. For example, the study
by Handy et al. (2002) provides a set of indicators to capture the built environment’s
characteristics to examine its impact on people’s transportation behavior. The
Table 4.1 Representative indicators of the physical features for the three scales
Scale
Indicator
Example of data
City Scale
Transportation
system
Road network, railroad system, etc.
Infrastructure and
public facilities
Water and sewage system, distribution of public facilities, etc.
Land-use pattern
Zoning map, land cover data, etc.
Neighborhood
Scale
Land use
Rate of farmland, vegetation, commercial buildings,
retail, office, factory, residential area, etc.
Shape of urban
tissue
Road width and shape, rate of public space, block shape,
building layout, etc.
Density
Building density, building-to-land ratio, floor space per
person, etc.
Percentage of
buildings by type
Number of buildings by building height, function,
structure, etc.
Building Scale Structure and
technology
Materials, construction method, etc.
Design
Style, decoration, volume, etc.
Function
Use of space, floor plan, etc.
48
K. Hayashi et al.