

As Fig. 11.6 shows, no significant correlation is visible between the score for
Nominal GDP and the average Environment score. In fact, the distribution of the
cities by these scores confirms such observation (Fig. 11.9, correlation coefficient ¼ 0.0803). However, it is notable that some patterns between Nominal GDP
and Environment are also observed. The European cities, with middle-tier Nominal
GDP scores, tend to receive high scores for Environment. Asian cities such as Hong
Kong, Beijing, and Shanghai have high scores for Nominal GDP, but lower scores
for Environment. Cities such as Los Angeles, Mexico City, and Chicago also have
high Nominal GDP scores but low Environment scores. Tokyo’s distinctiveness
clearly stands out in this comparison: the city has an extremely high score for
Nominal GDP and a top-tier average score for Environment.
Figure 11.7 shows the score for GDP per Capita and the average score for
Environment. It is visually observed that the patterns that the average Environment
score shows tend to coincide with those shown by GDP per Capita. As illustrated in
Fig. 11.9, a subtle positive correlation between the two variables is observed
(correlation coefficient ¼ 0.4068). The European cities, which show middle-tier
Nominal GDP scores, tend to show higher GDP per Capita scores, contributing to
the correlation. The emergent cities, which show relatively higher scores for Nominal GDP, show lower scores for GDP per Capita, reinforcing the trend. This
suggests a possibility that the quality (and not the scale) of the city’s economy
affects its ability to control urban sustainability.
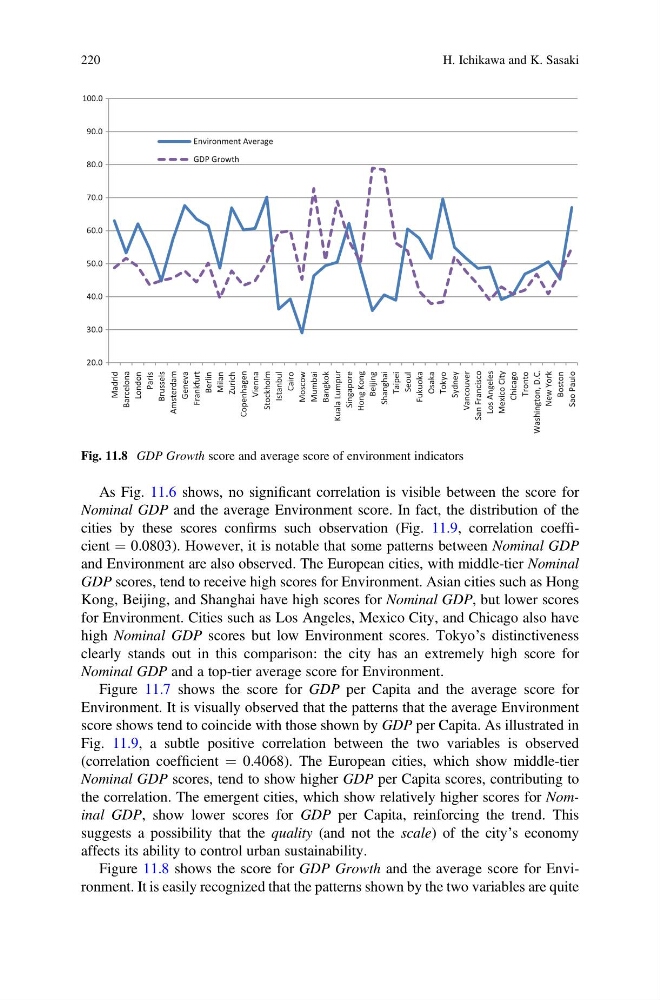
Figure 11.8 shows the score for GDP Growth and the average score for Environment. It is easily recognized that the patterns shown by the two variables are quite
20.0
30.0
40.0
50.0
60.0
70.0
80.0
90.0
100.0
Madrid
Barcelona
London
Paris
Brussels
Amsterdam
Geneva
Frankfurt
Berlin
Milan
Zurich
Copenhagen
Vienna
Stockholm
Istanbul
Cairo
Moscow
Mumbai
Bangkok
Kuala Lumpur
Singapore
Hong Kong
Beijing
Shanghai
Taipei
Seoul
Fukuoka
Osaka
Tokyo
Sydney
Vancouver
San Francisco
Los Angeles
Mexico City
Chicago
Tronto
Washington, D.C.
New York
Boston
Sao Paulo
Environment Average
GDP Growth
Fig. 11.8 GDP Growth score and average score of environment indicators
220
H. Ichikawa and K. Sasaki
Nominal GDP and the average Environment score. In fact, the distribution of the
cities by these scores confirms such observation (Fig. 11.9, correlation coefficient ¼ 0.0803). However, it is notable that some patterns between Nominal GDP
and Environment are also observed. The European cities, with middle-tier Nominal
GDP scores, tend to receive high scores for Environment. Asian cities such as Hong
Kong, Beijing, and Shanghai have high scores for Nominal GDP, but lower scores
for Environment. Cities such as Los Angeles, Mexico City, and Chicago also have
high Nominal GDP scores but low Environment scores. Tokyo’s distinctiveness
clearly stands out in this comparison: the city has an extremely high score for
Nominal GDP and a top-tier average score for Environment.
Figure 11.7 shows the score for GDP per Capita and the average score for
Environment. It is visually observed that the patterns that the average Environment
score shows tend to coincide with those shown by GDP per Capita. As illustrated in
Fig. 11.9, a subtle positive correlation between the two variables is observed
(correlation coefficient ¼ 0.4068). The European cities, which show middle-tier
Nominal GDP scores, tend to show higher GDP per Capita scores, contributing to
the correlation. The emergent cities, which show relatively higher scores for Nominal GDP, show lower scores for GDP per Capita, reinforcing the trend. This
suggests a possibility that the quality (and not the scale) of the city’s economy
affects its ability to control urban sustainability.
Figure 11.8 shows the score for GDP Growth and the average score for Environment. It is easily recognized that the patterns shown by the two variables are quite
20.0
30.0
40.0
50.0
60.0
70.0
80.0
90.0
100.0
Madrid
Barcelona
London
Paris
Brussels
Amsterdam
Geneva
Frankfurt
Berlin
Milan
Zurich
Copenhagen
Vienna
Stockholm
Istanbul
Cairo
Moscow
Mumbai
Bangkok
Kuala Lumpur
Singapore
Hong Kong
Beijing
Shanghai
Taipei
Seoul
Fukuoka
Osaka
Tokyo
Sydney
Vancouver
San Francisco
Los Angeles
Mexico City
Chicago
Tronto
Washington, D.C.
New York
Boston
Sao Paulo
Environment Average
GDP Growth
Fig. 11.8 GDP Growth score and average score of environment indicators
220
H. Ichikawa and K. Sasaki