

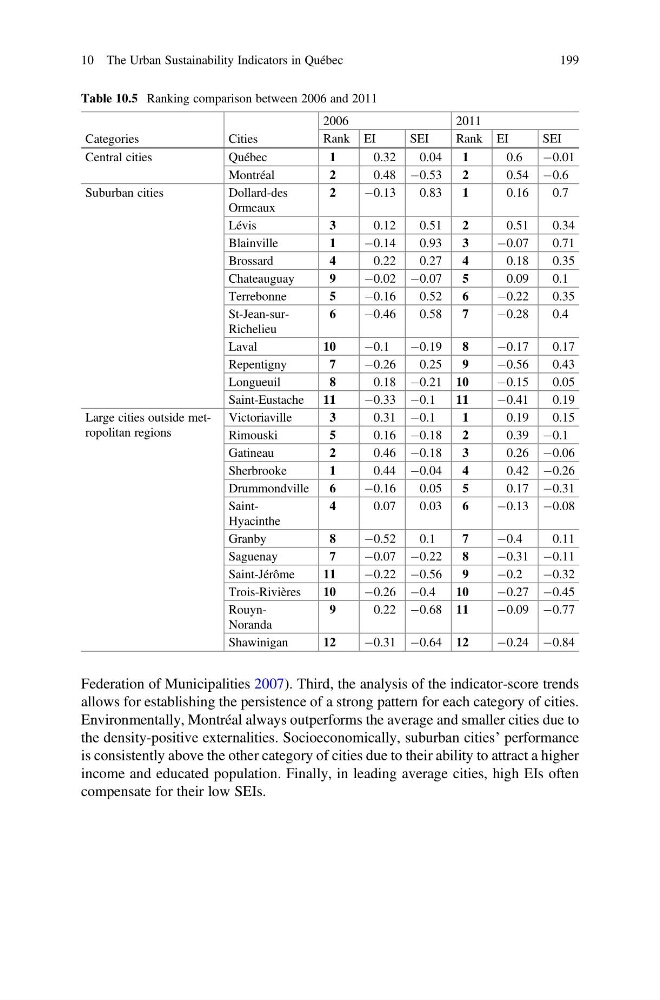
Federation of Municipalities 2007). Third, the analysis of the indicator-score trends
allows for establishing the persistence of a strong pattern for each category of cities.
Environmentally, Montréal always outperforms the average and smaller cities due to
the density-positive externalities. Socioeconomically, suburban cities’ performance
is consistently above the other category of cities due to their ability to attract a higher
income and educated population. Finally, in leading average cities, high EIs often
compensate for their low SEIs.
Table 10.5 Ranking comparison between 2006 and 2011
Categories
Cities
2006
2011
Rank EI
SEI
Rank EI
SEI
Central cities
Québec
1
0.32
0.04
1
0.6
À0.01
Montréal
2
0.48 À0.53
2
0.54 À0.6
Suburban cities
Dollard-des
Ormeaux
2
À0.13
0.83
1
0.16
0.7
Lévis
3
0.12
0.51
2
0.51
0.34
Blainville
1
À0.14
0.93
3
À0.07
0.71
Brossard
4
0.22
0.27
4
0.18
0.35
Chateauguay
9
À0.02 À0.07
5
0.09
0.1
Terrebonne
5
À0.16
0.52
6
À0.22
0.35
St-Jean-surRichelieu
6
À0.46
0.58
7
À0.28
0.4
Laval
10
À0.1
À0.19
8
À0.17
0.17
Repentigny
7
À0.26
0.25
9
À0.56
0.43
Longueuil
8
0.18 À0.21 10
À0.15
0.05
Saint-Eustache
11
À0.33 À0.1
11
À0.41
0.19
Large cities outside metropolitan regions
Victoriaville
3
0.31 À0.1
1
0.19
0.15
Rimouski
5
0.16 À0.18
2
0.39 À0.1
Gatineau
2
0.46 À0.18
3
0.26 À0.06
Sherbrooke
1
0.44 À0.04
4
0.42 À0.26
Drummondville
6
À0.16
0.05
5
0.17 À0.31
SaintHyacinthe
4
0.07
0.03
6
À0.13 À0.08
Granby
8
À0.52
0.1
7
À0.4
0.11
Saguenay
7
À0.07 À0.22
8
À0.31 À0.11
Saint-Jérôme
11
À0.22 À0.56
9
À0.2
À0.32
Trois-Rivières
10
À0.26 À0.4
10
À0.27 À0.45
RouynNoranda
9
0.22 À0.68 11
À0.09 À0.77
Shawinigan
12
À0.31 À0.64 12
À0.24 À0.84
10 The Urban Sustainability Indicators in Québec
199
allows for establishing the persistence of a strong pattern for each category of cities.
Environmentally, Montréal always outperforms the average and smaller cities due to
the density-positive externalities. Socioeconomically, suburban cities’ performance
is consistently above the other category of cities due to their ability to attract a higher
income and educated population. Finally, in leading average cities, high EIs often
compensate for their low SEIs.
Table 10.5 Ranking comparison between 2006 and 2011
Categories
Cities
2006
2011
Rank EI
SEI
Rank EI
SEI
Central cities
Québec
1
0.32
0.04
1
0.6
À0.01
Montréal
2
0.48 À0.53
2
0.54 À0.6
Suburban cities
Dollard-des
Ormeaux
2
À0.13
0.83
1
0.16
0.7
Lévis
3
0.12
0.51
2
0.51
0.34
Blainville
1
À0.14
0.93
3
À0.07
0.71
Brossard
4
0.22
0.27
4
0.18
0.35
Chateauguay
9
À0.02 À0.07
5
0.09
0.1
Terrebonne
5
À0.16
0.52
6
À0.22
0.35
St-Jean-surRichelieu
6
À0.46
0.58
7
À0.28
0.4
Laval
10
À0.1
À0.19
8
À0.17
0.17
Repentigny
7
À0.26
0.25
9
À0.56
0.43
Longueuil
8
0.18 À0.21 10
À0.15
0.05
Saint-Eustache
11
À0.33 À0.1
11
À0.41
0.19
Large cities outside metropolitan regions
Victoriaville
3
0.31 À0.1
1
0.19
0.15
Rimouski
5
0.16 À0.18
2
0.39 À0.1
Gatineau
2
0.46 À0.18
3
0.26 À0.06
Sherbrooke
1
0.44 À0.04
4
0.42 À0.26
Drummondville
6
À0.16
0.05
5
0.17 À0.31
SaintHyacinthe
4
0.07
0.03
6
À0.13 À0.08
Granby
8
À0.52
0.1
7
À0.4
0.11
Saguenay
7
À0.07 À0.22
8
À0.31 À0.11
Saint-Jérôme
11
À0.22 À0.56
9
À0.2
À0.32
Trois-Rivières
10
À0.26 À0.4
10
À0.27 À0.45
RouynNoranda
9
0.22 À0.68 11
À0.09 À0.77
Shawinigan
12
À0.31 À0.64 12
À0.24 À0.84
10 The Urban Sustainability Indicators in Québec
199