

the overall index. Non-compensatory aggregation methods are generally based on
classification rules (OECD 2008). These rules consist of the assignment of a rank to
each indicator so that the result of the aggregation considers only the ranks obtained
by the cities in each indicator. The main criticism of the classification rules is the fact
that the exceptional performance of some cities is voluntarily overlooked (Floridi
et al. 2011). In other words, such rules do not allow the gap between the cities in each
area represented by the indicators to be estimated.
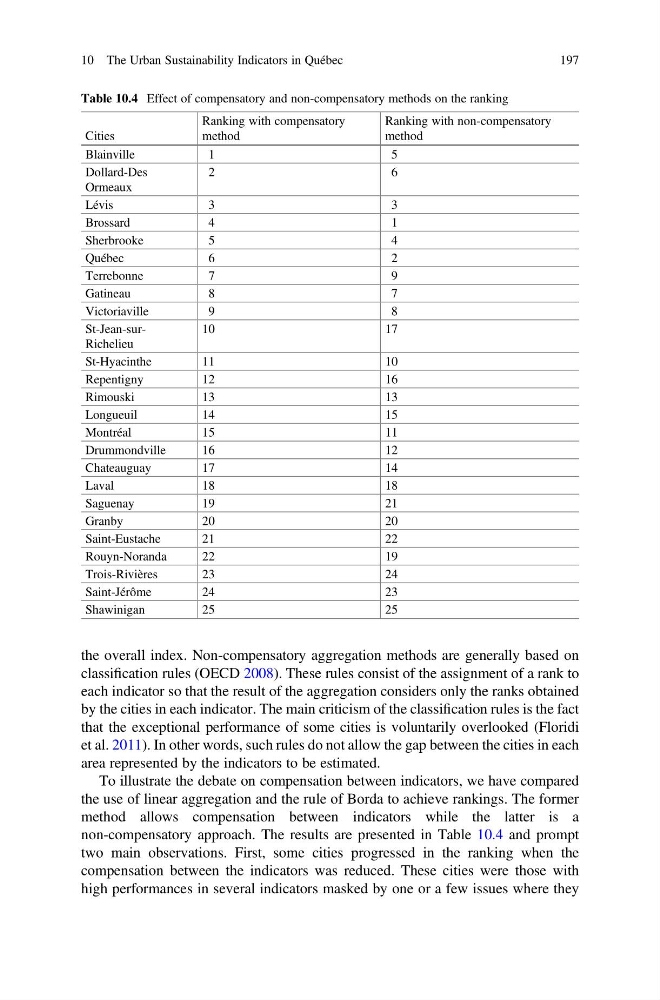
To illustrate the debate on compensation between indicators, we have compared
the use of linear aggregation and the rule of Borda to achieve rankings. The former
method allows compensation between indicators while the latter is a
non-compensatory approach. The results are presented in Table 10.4 and prompt
two main observations. First, some cities progressed in the ranking when the
compensation between the indicators was reduced. These cities were those with
high performances in several indicators masked by one or a few issues where they
Table 10.4 Effect of compensatory and non-compensatory methods on the ranking
Cities
Ranking with compensatory
method
Ranking with non-compensatory
method
Blainville
1
5
Dollard-Des
Ormeaux
2
6
Lévis
3
3
Brossard
4
1
Sherbrooke
5
4
Québec
6
2
Terrebonne
7
9
Gatineau
8
7
Victoriaville
9
8
St-Jean-surRichelieu
10
17
St-Hyacinthe
11
10
Repentigny
12
16
Rimouski
13
13
Longueuil
14
15
Montréal
15
11
Drummondville
16
12
Chateauguay
17
14
Laval
18
18
Saguenay
19
21
Granby
20
20
Saint-Eustache
21
22
Rouyn-Noranda
22
19
Trois-Rivières
23
24
Saint-Jérôme
24
23
Shawinigan
25
25
10 The Urban Sustainability Indicators in Québec
197
classification rules (OECD 2008). These rules consist of the assignment of a rank to
each indicator so that the result of the aggregation considers only the ranks obtained
by the cities in each indicator. The main criticism of the classification rules is the fact
that the exceptional performance of some cities is voluntarily overlooked (Floridi
et al. 2011). In other words, such rules do not allow the gap between the cities in each
area represented by the indicators to be estimated.
To illustrate the debate on compensation between indicators, we have compared
the use of linear aggregation and the rule of Borda to achieve rankings. The former
method allows compensation between indicators while the latter is a
non-compensatory approach. The results are presented in Table 10.4 and prompt
two main observations. First, some cities progressed in the ranking when the
compensation between the indicators was reduced. These cities were those with
high performances in several indicators masked by one or a few issues where they
Table 10.4 Effect of compensatory and non-compensatory methods on the ranking
Cities
Ranking with compensatory
method
Ranking with non-compensatory
method
Blainville
1
5
Dollard-Des
Ormeaux
2
6
Lévis
3
3
Brossard
4
1
Sherbrooke
5
4
Québec
6
2
Terrebonne
7
9
Gatineau
8
7
Victoriaville
9
8
St-Jean-surRichelieu
10
17
St-Hyacinthe
11
10
Repentigny
12
16
Rimouski
13
13
Longueuil
14
15
Montréal
15
11
Drummondville
16
12
Chateauguay
17
14
Laval
18
18
Saguenay
19
21
Granby
20
20
Saint-Eustache
21
22
Rouyn-Noranda
22
19
Trois-Rivières
23
24
Saint-Jérôme
24
23
Shawinigan
25
25
10 The Urban Sustainability Indicators in Québec
197