

10.5.2 Compensation Between Indicators
The second criterion is to minimize the compensation between indicators. According
to this criterion, the best-performing cities are the ones whose global performances
are not the result of compensation. Such compensation is a common issue in
measuring the sustainability of cities, especially when they are aggregated into
indices. The cities’ strengths and weaknesses can be highlighted using radar diagrams. The use of radar diagrams is an additional means to facilitate the interpretation and communication of indicators. Their use allows the identification of the main
factors at the origin of the strengths and weaknesses of each city’s environmental
index (EI) and socioeconomic index (SEI), as well as the indicators aid decisionmaking processes (Wong 2006).
For example, Fig. 10.1 presents two radar diagrams on the contribution of
indicators to the environmental and socioeconomic indices for Montréal and its
average suburban city. First, at the environmental level, we observe that Montréal’s
relatively high performance is mainly due to its good performance in the public
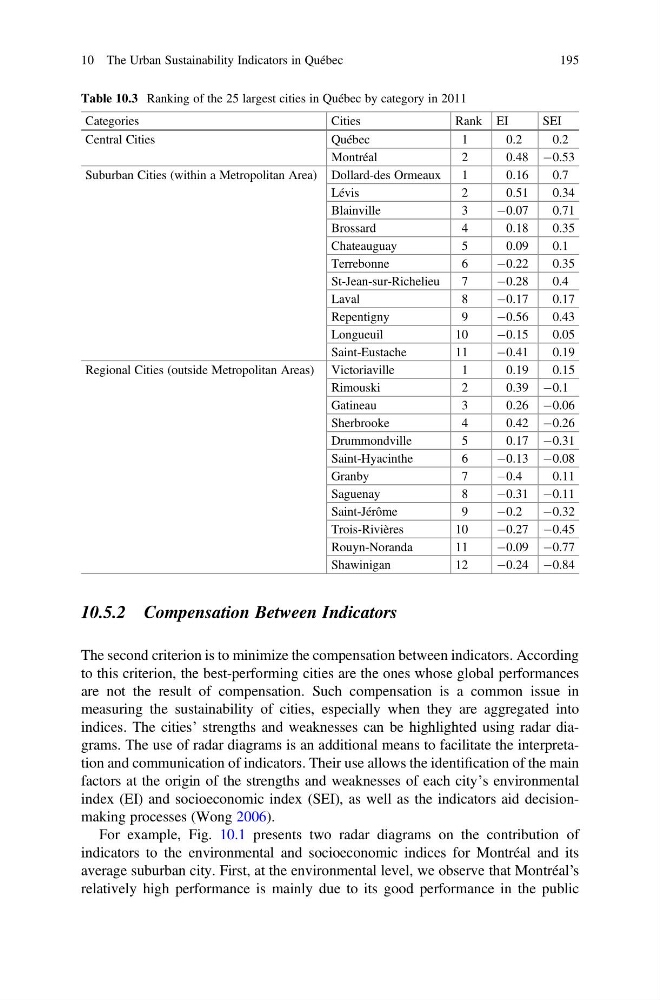
Table 10.3 Ranking of the 25 largest cities in Québec by category in 2011
Categories
Cities
Rank EI
SEI
Central Cities
Québec
1
0.2
0.2
Montréal
2
0.48 À0.53
Suburban Cities (within a Metropolitan Area) Dollard-des Ormeaux
1
0.16
0.7
Lévis
2
0.51
0.34
Blainville
3
À0.07
0.71
Brossard
4
0.18
0.35
Chateauguay
5
0.09
0.1
Terrebonne
6
À0.22
0.35
St-Jean-sur-Richelieu
7
À0.28
0.4
Laval
8
À0.17
0.17
Repentigny
9
À0.56
0.43
Longueuil
10
À0.15
0.05
Saint-Eustache
11
À0.41
0.19
Regional Cities (outside Metropolitan Areas) Victoriaville
1
0.19
0.15
Rimouski
2
0.39 À0.1
Gatineau
3
0.26 À0.06
Sherbrooke
4
0.42 À0.26
Drummondville
5
0.17 À0.31
Saint-Hyacinthe
6
À0.13 À0.08
Granby
7
À0.4
0.11
Saguenay
8
À0.31 À0.11
Saint-Jérôme
9
À0.2
À0.32
Trois-Rivières
10
À0.27 À0.45
Rouyn-Noranda
11
À0.09 À0.77
Shawinigan
12
À0.24 À0.84
10 The Urban Sustainability Indicators in Québec
195
The second criterion is to minimize the compensation between indicators. According
to this criterion, the best-performing cities are the ones whose global performances
are not the result of compensation. Such compensation is a common issue in
measuring the sustainability of cities, especially when they are aggregated into
indices. The cities’ strengths and weaknesses can be highlighted using radar diagrams. The use of radar diagrams is an additional means to facilitate the interpretation and communication of indicators. Their use allows the identification of the main
factors at the origin of the strengths and weaknesses of each city’s environmental
index (EI) and socioeconomic index (SEI), as well as the indicators aid decisionmaking processes (Wong 2006).
For example, Fig. 10.1 presents two radar diagrams on the contribution of
indicators to the environmental and socioeconomic indices for Montréal and its
average suburban city. First, at the environmental level, we observe that Montréal’s
relatively high performance is mainly due to its good performance in the public
Table 10.3 Ranking of the 25 largest cities in Québec by category in 2011
Categories
Cities
Rank EI
SEI
Central Cities
Québec
1
0.2
0.2
Montréal
2
0.48 À0.53
Suburban Cities (within a Metropolitan Area) Dollard-des Ormeaux
1
0.16
0.7
Lévis
2
0.51
0.34
Blainville
3
À0.07
0.71
Brossard
4
0.18
0.35
Chateauguay
5
0.09
0.1
Terrebonne
6
À0.22
0.35
St-Jean-sur-Richelieu
7
À0.28
0.4
Laval
8
À0.17
0.17
Repentigny
9
À0.56
0.43
Longueuil
10
À0.15
0.05
Saint-Eustache
11
À0.41
0.19
Regional Cities (outside Metropolitan Areas) Victoriaville
1
0.19
0.15
Rimouski
2
0.39 À0.1
Gatineau
3
0.26 À0.06
Sherbrooke
4
0.42 À0.26
Drummondville
5
0.17 À0.31
Saint-Hyacinthe
6
À0.13 À0.08
Granby
7
À0.4
0.11
Saguenay
8
À0.31 À0.11
Saint-Jérôme
9
À0.2
À0.32
Trois-Rivières
10
À0.27 À0.45
Rouyn-Noranda
11
À0.09 À0.77
Shawinigan
12
À0.24 À0.84
10 The Urban Sustainability Indicators in Québec
195