

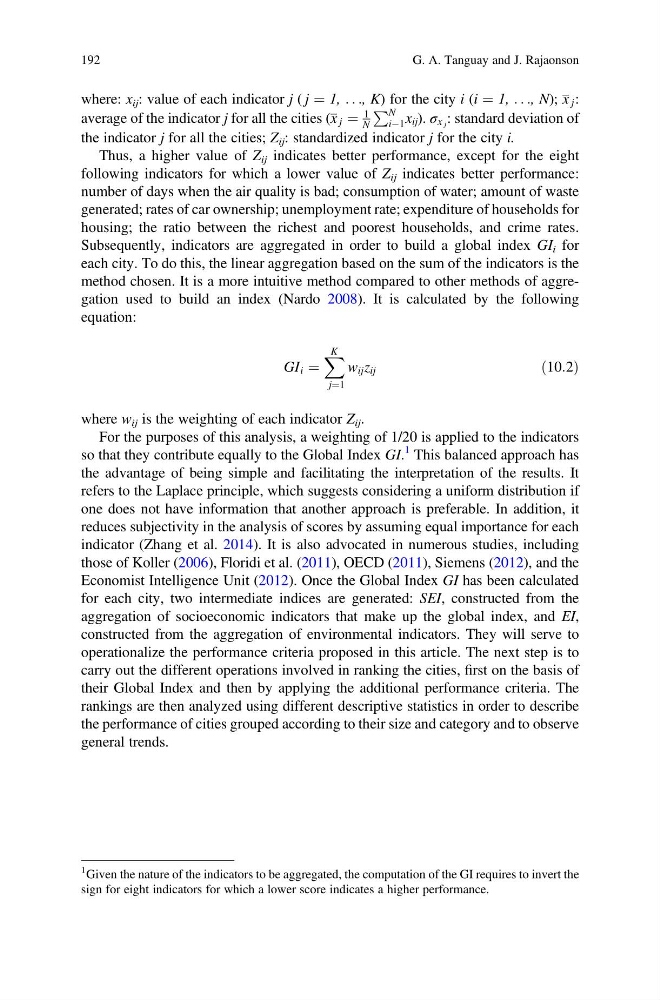
where: x ij : value of each indicator j ( j ¼ 1, . . ., K) for the city i (i ¼ 1, . . ., N); x j :
average of the indicator j for all the cities (x j ¼
1
N
P N
iÀ1 x ij ). σ x j : standard deviation of
the indicator j for all the cities; Z ij : standardized indicator j for the city i.
Thus, a higher value of Z ij indicates better performance, except for the eight
following indicators for which a lower value of Z ij indicates better performance:
number of days when the air quality is bad; consumption of water; amount of waste
generated; rates of car ownership; unemployment rate; expenditure of households for
housing; the ratio between the richest and poorest households, and crime rates.
Subsequently, indicators are aggregated in order to build a global index GI i for
each city. To do this, the linear aggregation based on the sum of the indicators is the
method chosen. It is a more intuitive method compared to other methods of aggregation used to build an index (Nardo 2008). It is calculated by the following
equation:
GI i ¼
X K
j¼1
w ij z ij
ð10:2Þ
where w ij is the weighting of each indicator Z ij .
For the purposes of this analysis, a weighting of 1/20 is applied to the indicators
so that they contribute equally to the Global Index GI.
1 This balanced approach has
the advantage of being simple and facilitating the interpretation of the results. It
refers to the Laplace principle, which suggests considering a uniform distribution if
one does not have information that another approach is preferable. In addition, it
reduces subjectivity in the analysis of scores by assuming equal importance for each
indicator (Zhang et al. 2014). It is also advocated in numerous studies, including
those of Koller (2006), Floridi et al. (2011), OECD (2011), Siemens (2012), and the
Economist Intelligence Unit (2012). Once the Global Index GI has been calculated
for each city, two intermediate indices are generated: SEI, constructed from the
aggregation of socioeconomic indicators that make up the global index, and EI,
constructed from the aggregation of environmental indicators. They will serve to
operationalize the performance criteria proposed in this article. The next step is to
carry out the different operations involved in ranking the cities, first on the basis of
their Global Index and then by applying the additional performance criteria. The
rankings are then analyzed using different descriptive statistics in order to describe
the performance of cities grouped according to their size and category and to observe
general trends.
1 Given the nature of the indicators to be aggregated, the computation of the GI requires to invert the
sign for eight indicators for which a lower score indicates a higher performance.
192
G. A. Tanguay and J. Rajaonson
average of the indicator j for all the cities (x j ¼
1
N
P N
iÀ1 x ij ). σ x j : standard deviation of
the indicator j for all the cities; Z ij : standardized indicator j for the city i.
Thus, a higher value of Z ij indicates better performance, except for the eight
following indicators for which a lower value of Z ij indicates better performance:
number of days when the air quality is bad; consumption of water; amount of waste
generated; rates of car ownership; unemployment rate; expenditure of households for
housing; the ratio between the richest and poorest households, and crime rates.
Subsequently, indicators are aggregated in order to build a global index GI i for
each city. To do this, the linear aggregation based on the sum of the indicators is the
method chosen. It is a more intuitive method compared to other methods of aggregation used to build an index (Nardo 2008). It is calculated by the following
equation:
GI i ¼
X K
j¼1
w ij z ij
ð10:2Þ
where w ij is the weighting of each indicator Z ij .
For the purposes of this analysis, a weighting of 1/20 is applied to the indicators
so that they contribute equally to the Global Index GI.
1 This balanced approach has
the advantage of being simple and facilitating the interpretation of the results. It
refers to the Laplace principle, which suggests considering a uniform distribution if
one does not have information that another approach is preferable. In addition, it
reduces subjectivity in the analysis of scores by assuming equal importance for each
indicator (Zhang et al. 2014). It is also advocated in numerous studies, including
those of Koller (2006), Floridi et al. (2011), OECD (2011), Siemens (2012), and the
Economist Intelligence Unit (2012). Once the Global Index GI has been calculated
for each city, two intermediate indices are generated: SEI, constructed from the
aggregation of socioeconomic indicators that make up the global index, and EI,
constructed from the aggregation of environmental indicators. They will serve to
operationalize the performance criteria proposed in this article. The next step is to
carry out the different operations involved in ranking the cities, first on the basis of
their Global Index and then by applying the additional performance criteria. The
rankings are then analyzed using different descriptive statistics in order to describe
the performance of cities grouped according to their size and category and to observe
general trends.
1 Given the nature of the indicators to be aggregated, the computation of the GI requires to invert the
sign for eight indicators for which a lower score indicates a higher performance.
192
G. A. Tanguay and J. Rajaonson