

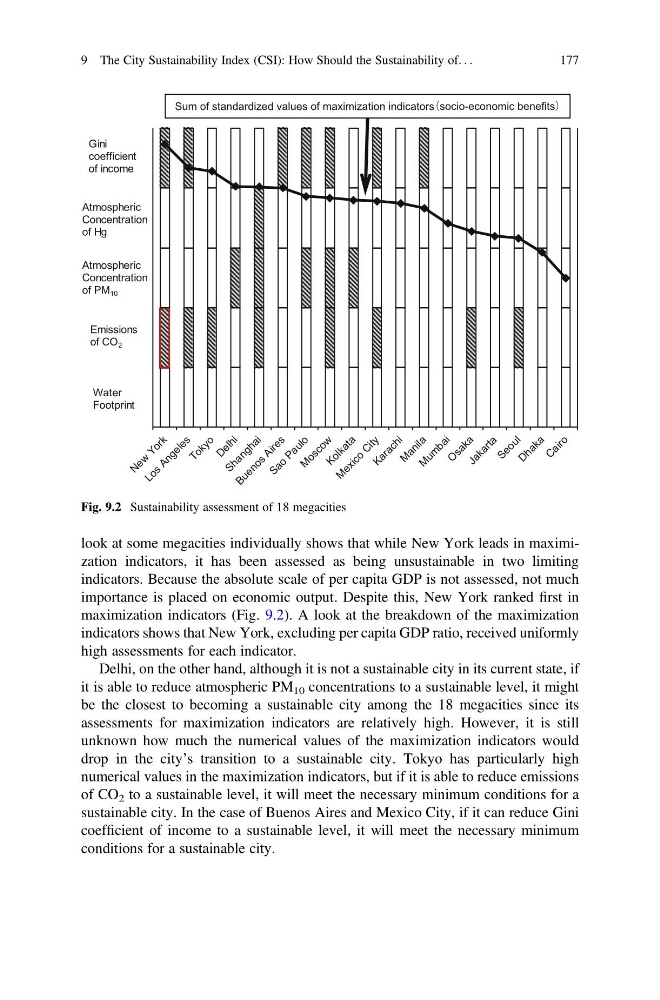
look at some megacities individually shows that while New York leads in maximization indicators, it has been assessed as being unsustainable in two limiting
indicators. Because the absolute scale of per capita GDP is not assessed, not much
importance is placed on economic output. Despite this, New York ranked first in
maximization indicators (Fig. 9.2). A look at the breakdown of the maximization
indicators shows that New York, excluding per capita GDP ratio, received uniformly
high assessments for each indicator.
Delhi, on the other hand, although it is not a sustainable city in its current state, if
it is able to reduce atmospheric PM 10 concentrations to a sustainable level, it might
be the closest to becoming a sustainable city among the 18 megacities since its
assessments for maximization indicators are relatively high. However, it is still
unknown how much the numerical values of the maximization indicators would
drop in the city’s transition to a sustainable city. Tokyo has particularly high
numerical values in the maximization indicators, but if it is able to reduce emissions
of CO 2 to a sustainable level, it will meet the necessary minimum conditions for a
sustainable city. In the case of Buenos Aires and Mexico City, if it can reduce Gini
coefficient of income to a sustainable level, it will meet the necessary minimum
conditions for a sustainable city.
Sum of standardized values of maximization indicators
Water
Footprint
Atmospheric
Concentration
of Hg
Emissions
of CO 2
Atmospheric
Concentration
of PM 10
Gini
coefficient
of income
socio-economic benefits
Fig. 9.2 Sustainability assessment of 18 megacities
9 The City Sustainability Index (CSI): How Should the Sustainability of. . .
177
indicators. Because the absolute scale of per capita GDP is not assessed, not much
importance is placed on economic output. Despite this, New York ranked first in
maximization indicators (Fig. 9.2). A look at the breakdown of the maximization
indicators shows that New York, excluding per capita GDP ratio, received uniformly
high assessments for each indicator.
Delhi, on the other hand, although it is not a sustainable city in its current state, if
it is able to reduce atmospheric PM 10 concentrations to a sustainable level, it might
be the closest to becoming a sustainable city among the 18 megacities since its
assessments for maximization indicators are relatively high. However, it is still
unknown how much the numerical values of the maximization indicators would
drop in the city’s transition to a sustainable city. Tokyo has particularly high
numerical values in the maximization indicators, but if it is able to reduce emissions
of CO 2 to a sustainable level, it will meet the necessary minimum conditions for a
sustainable city. In the case of Buenos Aires and Mexico City, if it can reduce Gini
coefficient of income to a sustainable level, it will meet the necessary minimum
conditions for a sustainable city.
Sum of standardized values of maximization indicators
Water
Footprint
Atmospheric
Concentration
of Hg
Emissions
of CO 2
Atmospheric
Concentration
of PM 10
Gini
coefficient
of income
socio-economic benefits
Fig. 9.2 Sustainability assessment of 18 megacities
9 The City Sustainability Index (CSI): How Should the Sustainability of. . .
177