

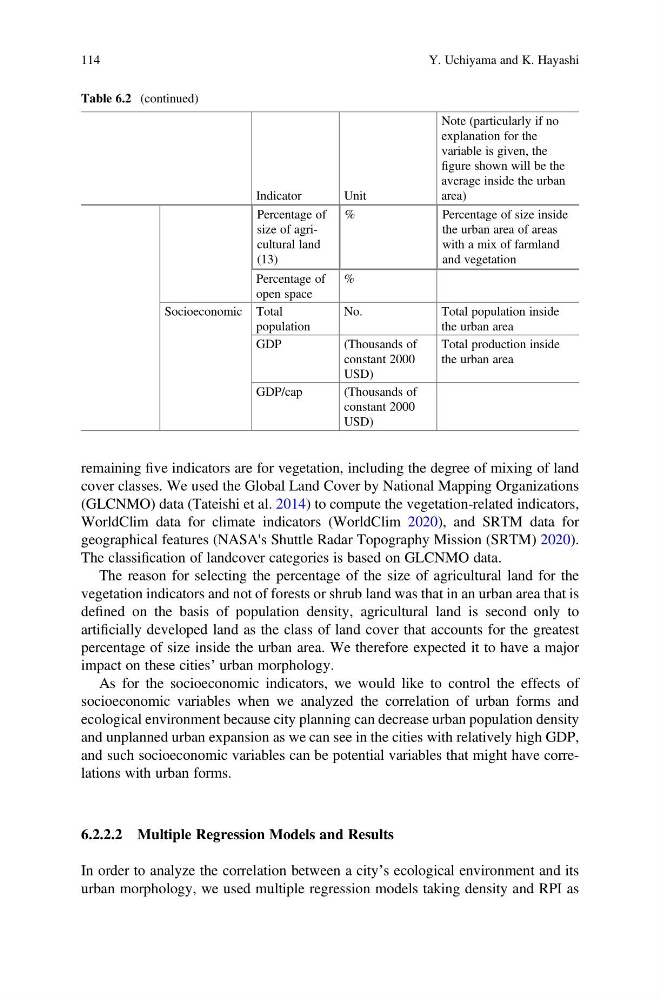
remaining five indicators are for vegetation, including the degree of mixing of land
cover classes. We used the Global Land Cover by National Mapping Organizations
(GLCNMO) data (Tateishi et al. 2014) to compute the vegetation-related indicators,
WorldClim data for climate indicators (WorldClim 2020), and SRTM data for
geographical features (NASA's Shuttle Radar Topography Mission (SRTM) 2020).
The classification of landcover categories is based on GLCNMO data.
The reason for selecting the percentage of the size of agricultural land for the
vegetation indicators and not of forests or shrub land was that in an urban area that is
defined on the basis of population density, agricultural land is second only to
artificially developed land as the class of land cover that accounts for the greatest
percentage of size inside the urban area. We therefore expected it to have a major
impact on these cities’ urban morphology.
As for the socioeconomic indicators, we would like to control the effects of
socioeconomic variables when we analyzed the correlation of urban forms and
ecological environment because city planning can decrease urban population density
and unplanned urban expansion as we can see in the cities with relatively high GDP,
and such socioeconomic variables can be potential variables that might have correlations with urban forms.
6.2.2.2 Multiple Regression Models and Results
In order to analyze the correlation between a city’s ecological environment and its
urban morphology, we used multiple regression models taking density and RPI as
Table 6.2 (continued)
Indicator
Unit
Note (particularly if no
explanation for the
variable is given, the
figure shown will be the
average inside the urban
area)
Percentage of
size of agricultural land
(13)
%
Percentage of size inside
the urban area of areas
with a mix of farmland
and vegetation
Percentage of
open space
%
Socioeconomic Total
population
No.
Total population inside
the urban area
GDP
(Thousands of
constant 2000
USD)
Total production inside
the urban area
GDP/cap
(Thousands of
constant 2000
USD)
114
Y. Uchiyama and K. Hayashi
cover classes. We used the Global Land Cover by National Mapping Organizations
(GLCNMO) data (Tateishi et al. 2014) to compute the vegetation-related indicators,
WorldClim data for climate indicators (WorldClim 2020), and SRTM data for
geographical features (NASA's Shuttle Radar Topography Mission (SRTM) 2020).
The classification of landcover categories is based on GLCNMO data.
The reason for selecting the percentage of the size of agricultural land for the
vegetation indicators and not of forests or shrub land was that in an urban area that is
defined on the basis of population density, agricultural land is second only to
artificially developed land as the class of land cover that accounts for the greatest
percentage of size inside the urban area. We therefore expected it to have a major
impact on these cities’ urban morphology.
As for the socioeconomic indicators, we would like to control the effects of
socioeconomic variables when we analyzed the correlation of urban forms and
ecological environment because city planning can decrease urban population density
and unplanned urban expansion as we can see in the cities with relatively high GDP,
and such socioeconomic variables can be potential variables that might have correlations with urban forms.
6.2.2.2 Multiple Regression Models and Results
In order to analyze the correlation between a city’s ecological environment and its
urban morphology, we used multiple regression models taking density and RPI as
Table 6.2 (continued)
Indicator
Unit
Note (particularly if no
explanation for the
variable is given, the
figure shown will be the
average inside the urban
area)
Percentage of
size of agricultural land
(13)
%
Percentage of size inside
the urban area of areas
with a mix of farmland
and vegetation
Percentage of
open space
%
Socioeconomic Total
population
No.
Total population inside
the urban area
GDP
(Thousands of
constant 2000
USD)
Total production inside
the urban area
GDP/cap
(Thousands of
constant 2000
USD)
114
Y. Uchiyama and K. Hayashi