

51
predictions showed the ozone hole rapidly growing to 20 times its size, from 1.1
million square kilometers to 22.4 million square kilometers, by 1987. International
governments listened to the science and took clear and definitive international
action. To limit increased expansion of the ozone hole, they signed a binding agreement to limit the amount of ozone-depleting gasses each country could emit.
Because of the relatively quick agreement and response by industry and government
leaders with strong public support, the hole that was steadily growing 30 years ago
has stopped expanding and is now expected to heal itself through the production of
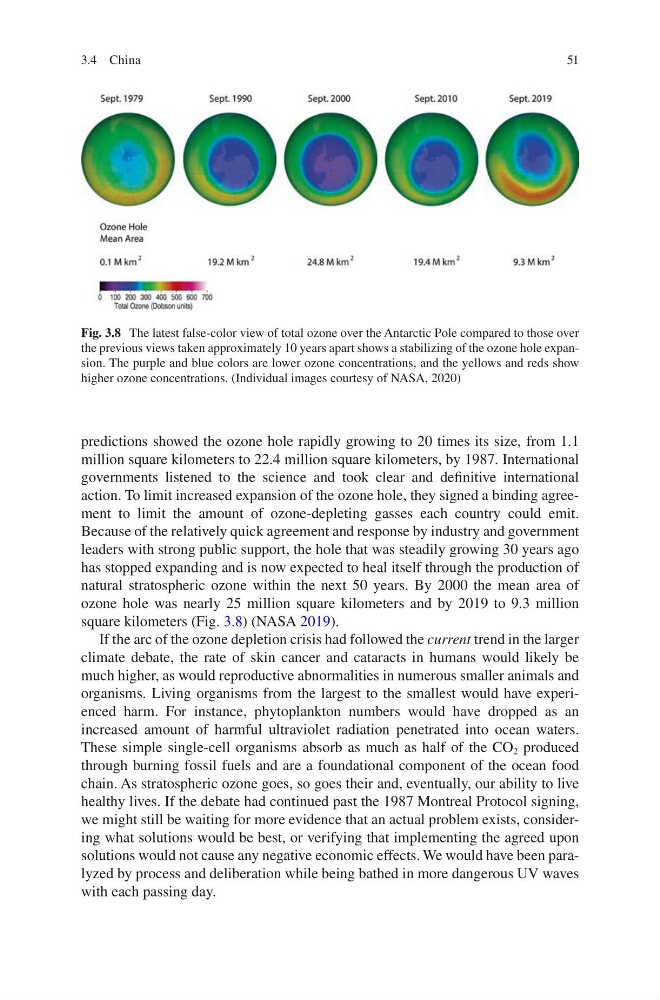
natural stratospheric ozone within the next 50 years. By 2000 the mean area of
ozone hole was nearly 25 million square kilometers and by 2019 to 9.3 million
square kilometers (Fig. 3.8) (NASA 2019).
If the arc of the ozone depletion crisis had followed the current trend in the larger
climate debate, the rate of skin cancer and cataracts in humans would likely be
much higher, as would reproductive abnormalities in numerous smaller animals and
organisms. Living organisms from the largest to the smallest would have experienced harm. For instance, phytoplankton numbers would have dropped as an
increased amount of harmful ultraviolet radiation penetrated into ocean waters.
These simple single-cell organisms absorb as much as half of the CO 2 produced
through burning fossil fuels and are a foundational component of the ocean food
chain. As stratospheric ozone goes, so goes their and, eventually, our ability to live
healthy lives. If the debate had continued past the 1987 Montreal Protocol signing,
we might still be waiting for more evidence that an actual problem exists, considering what solutions would be best, or verifying that implementing the agreed upon
solutions would not cause any negative economic effects. We would have been paralyzed by process and deliberation while being bathed in more dangerous UV waves
with each passing day.
Fig. 3.8 The latest false-color view of total ozone over the Antarctic Pole compared to those over
the previous views taken approximately 10 years apart shows a stabilizing of the ozone hole expansion. The purple and blue colors are lower ozone concentrations, and the yellows and reds show
higher ozone concentrations. (Individual images courtesy of NASA, 2020)
3.4 China
predictions showed the ozone hole rapidly growing to 20 times its size, from 1.1
million square kilometers to 22.4 million square kilometers, by 1987. International
governments listened to the science and took clear and definitive international
action. To limit increased expansion of the ozone hole, they signed a binding agreement to limit the amount of ozone-depleting gasses each country could emit.
Because of the relatively quick agreement and response by industry and government
leaders with strong public support, the hole that was steadily growing 30 years ago
has stopped expanding and is now expected to heal itself through the production of
natural stratospheric ozone within the next 50 years. By 2000 the mean area of
ozone hole was nearly 25 million square kilometers and by 2019 to 9.3 million
square kilometers (Fig. 3.8) (NASA 2019).
If the arc of the ozone depletion crisis had followed the current trend in the larger
climate debate, the rate of skin cancer and cataracts in humans would likely be
much higher, as would reproductive abnormalities in numerous smaller animals and
organisms. Living organisms from the largest to the smallest would have experienced harm. For instance, phytoplankton numbers would have dropped as an
increased amount of harmful ultraviolet radiation penetrated into ocean waters.
These simple single-cell organisms absorb as much as half of the CO 2 produced
through burning fossil fuels and are a foundational component of the ocean food
chain. As stratospheric ozone goes, so goes their and, eventually, our ability to live
healthy lives. If the debate had continued past the 1987 Montreal Protocol signing,
we might still be waiting for more evidence that an actual problem exists, considering what solutions would be best, or verifying that implementing the agreed upon
solutions would not cause any negative economic effects. We would have been paralyzed by process and deliberation while being bathed in more dangerous UV waves
with each passing day.
Fig. 3.8 The latest false-color view of total ozone over the Antarctic Pole compared to those over
the previous views taken approximately 10 years apart shows a stabilizing of the ozone hole expansion. The purple and blue colors are lower ozone concentrations, and the yellows and reds show
higher ozone concentrations. (Individual images courtesy of NASA, 2020)
3.4 China