

500
Graphs and Trees
12. An idea closely related to the average degree of separation in a graph is that of clustering. The global
clustering coefficient for a given graph is given by
C =
3 * T
t
where T = the number of triangles in the graph and t = the number of connected node triples.
A connected node triple is a “center” node adjacent to an unordered pair of other nodes. For example, in the
graph of Exercise 2, 3–4–5 (or 5–4–3) and 4–5–6 (6–5–4) are two such triples. Nodes that make up a triangle
demonstrate transitivity; if a is adjacent to b and b is adjacent to c, then a is adjacent to c. Therefore c is a ratio of
nodes in a transitive threesome to all nodes in a threesome. (One might think of this in terms of a social network
as the probability that if you are a “friend” of mine and x is a “friend” of yours, then x is also a “friend” of mine.)
a. Consider the graph in Figure 6.28 and the graph for Exercise 2. Which do you think has the higher
clustering coefficient?
b. Compute the clustering coefficient for the graph in Figure 6.28
c. Compute the clustering coefficient for the graph for Exercise 2.
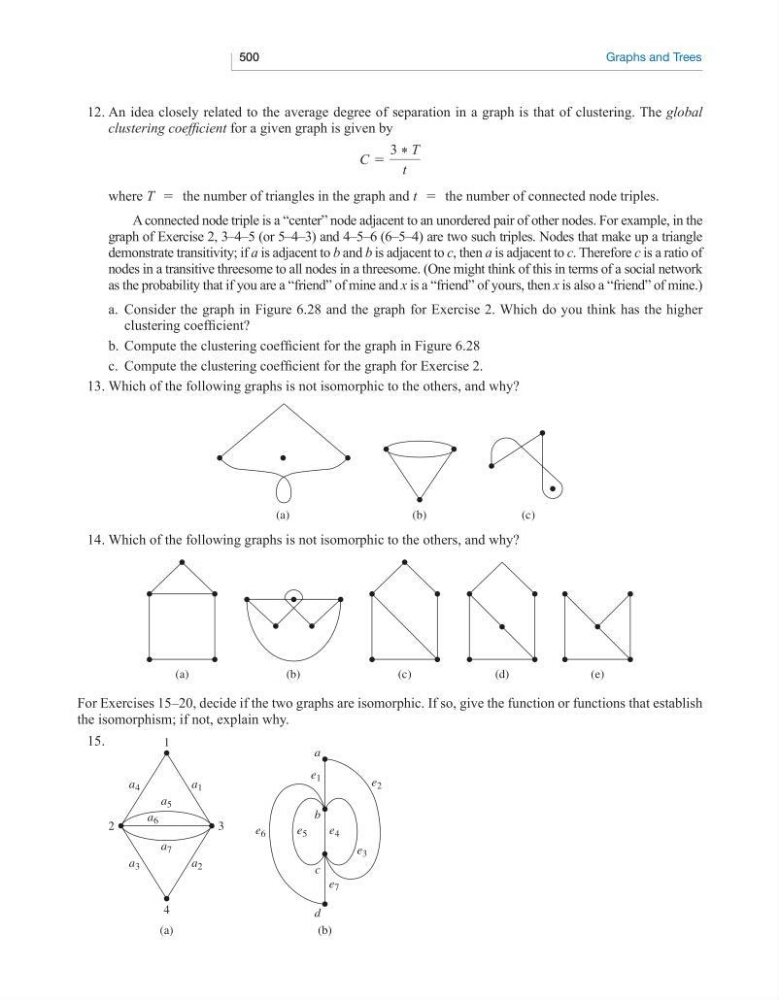
13. Which of the following graphs is not isomorphic to the others, and why?
(b)
(c)
(a)
14. Which of the following graphs is not isomorphic to the others, and why?
(a)
(c)
(d)
(e)
(b)
For Exercises 15–20, decide if the two graphs are isomorphic. If so, give the function or functions that establish
the isomorphism; if not, explain why.
15.
1
2
3
a 5
a 7
a 6
a 1
a
d
c
b
a 4
4
(a)
(b)
a 2
e 5
e 4
e 1
e 2
e 7
e 3
e 6
a 3
Graphs and Trees
12. An idea closely related to the average degree of separation in a graph is that of clustering. The global
clustering coefficient for a given graph is given by
C =
3 * T
t
where T = the number of triangles in the graph and t = the number of connected node triples.
A connected node triple is a “center” node adjacent to an unordered pair of other nodes. For example, in the
graph of Exercise 2, 3–4–5 (or 5–4–3) and 4–5–6 (6–5–4) are two such triples. Nodes that make up a triangle
demonstrate transitivity; if a is adjacent to b and b is adjacent to c, then a is adjacent to c. Therefore c is a ratio of
nodes in a transitive threesome to all nodes in a threesome. (One might think of this in terms of a social network
as the probability that if you are a “friend” of mine and x is a “friend” of yours, then x is also a “friend” of mine.)
a. Consider the graph in Figure 6.28 and the graph for Exercise 2. Which do you think has the higher
clustering coefficient?
b. Compute the clustering coefficient for the graph in Figure 6.28
c. Compute the clustering coefficient for the graph for Exercise 2.
13. Which of the following graphs is not isomorphic to the others, and why?
(b)
(c)
(a)
14. Which of the following graphs is not isomorphic to the others, and why?
(a)
(c)
(d)
(e)
(b)
For Exercises 15–20, decide if the two graphs are isomorphic. If so, give the function or functions that establish
the isomorphism; if not, explain why.
15.
1
2
3
a 5
a 7
a 6
a 1
a
d
c
b
a 4
4
(a)
(b)
a 2
e 5
e 4
e 1
e 2
e 7
e 3
e 6
a 3