

Section 6.1 Graphs and Their Representations
477
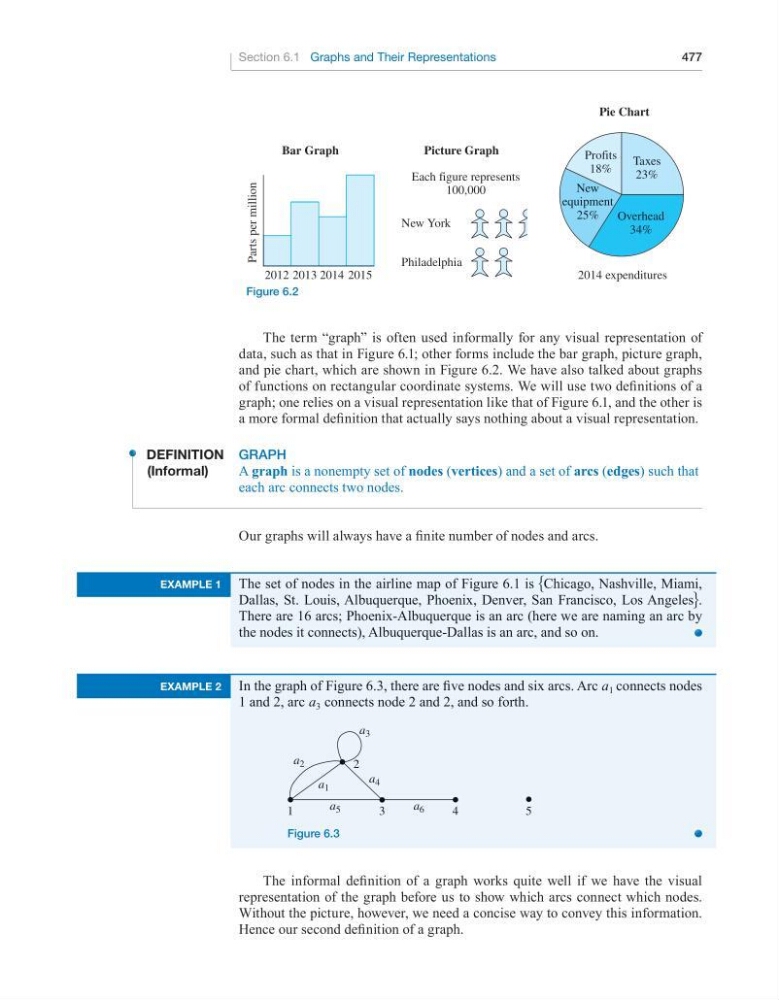
The term “graph” is often used informally for any visual representation of
data, such as that in Figure 6.1; other forms include the bar graph, picture graph,
and pie chart, which are shown in Figure 6.2. We have also talked about graphs
of functions on rectangular coordinate systems. We will use two definitions of a
graph; one relies on a visual representation like that of Figure 6.1, and the other is
a more formal definition that actually says nothing about a visual representation.
Definition Graph
(informal)
A graph is a nonempty set of nodes (vertices) and a set of arcs (edges) such that
each arc connects two nodes.
Our graphs will always have a finite number of nodes and arcs.
2014 expenditures
2012 2013 2014 2015
Profits
18%
Taxes
23%
New
equipment
25%
Overhead
34%
Each figure represents
100,000
New York
Philadelphia
Parts per million
Bar Graph
Picture Graph
Pie Chart
Figure 6.2
example 1
The set of nodes in the airline map of Figure 6.1 is EChicago, Nashville, Miami,
Dallas, St. Louis, Albuquerque, Phoenix, Denver, San Francisco, Los AngelesF.
There are 16 arcs; Phoenix-Albuquerque is an arc (here we are naming an arc by
the nodes it connects), Albuquerque-Dallas is an arc, and so on.
The informal definition of a graph works quite well if we have the visual
representation of the graph before us to show which arcs connect which nodes.
Without the picture, however, we need a concise way to convey this information.
Hence our second definition of a graph.
example 2
In the graph of Figure 6.3, there are five nodes and six arcs. Arc a 1 connects nodes
1 and 2, arc a 3 connects node 2 and 2, and so forth.
1
3
4
5
a 1
2
a 2
a 3
a 4
a 5
a 6
Figure 6.3
477
The term “graph” is often used informally for any visual representation of
data, such as that in Figure 6.1; other forms include the bar graph, picture graph,
and pie chart, which are shown in Figure 6.2. We have also talked about graphs
of functions on rectangular coordinate systems. We will use two definitions of a
graph; one relies on a visual representation like that of Figure 6.1, and the other is
a more formal definition that actually says nothing about a visual representation.
Definition Graph
(informal)
A graph is a nonempty set of nodes (vertices) and a set of arcs (edges) such that
each arc connects two nodes.
Our graphs will always have a finite number of nodes and arcs.
2014 expenditures
2012 2013 2014 2015
Profits
18%
Taxes
23%
New
equipment
25%
Overhead
34%
Each figure represents
100,000
New York
Philadelphia
Parts per million
Bar Graph
Picture Graph
Pie Chart
Figure 6.2
example 1
The set of nodes in the airline map of Figure 6.1 is EChicago, Nashville, Miami,
Dallas, St. Louis, Albuquerque, Phoenix, Denver, San Francisco, Los AngelesF.
There are 16 arcs; Phoenix-Albuquerque is an arc (here we are naming an arc by
the nodes it connects), Albuquerque-Dallas is an arc, and so on.
The informal definition of a graph works quite well if we have the visual
representation of the graph before us to show which arcs connect which nodes.
Without the picture, however, we need a concise way to convey this information.
Hence our second definition of a graph.
example 2
In the graph of Figure 6.3, there are five nodes and six arcs. Arc a 1 connects nodes
1 and 2, arc a 3 connects node 2 and 2, and so forth.
1
3
4
5
a 1
2
a 2
a 3
a 4
a 5
a 6
Figure 6.3