

358
Relations, Functions, and Matrices
A project represented by a PERT chart must begin with the tasks at the leftmost edge of the PERT chart and end with the tasks at the rightmost edge. An
upper limit on the time required to complete the project can be obtained by adding
the times for performing each task, but this does not take into account the fact
that perhaps some tasks can be performed in parallel, such as tasks 2 through 5 in
Example 16. To obtain the minimum time required to complete the project, we can
move through the chart from left to right, computing for each node the minimum
time to complete the work from the beginning through the work at that node. If a
node x has multiple nodes as prerequisites, all the prerequisite tasks must be completed before we can begin work on x; thus we must add the time for task x to the
maximum completion time of the prerequisite nodes.
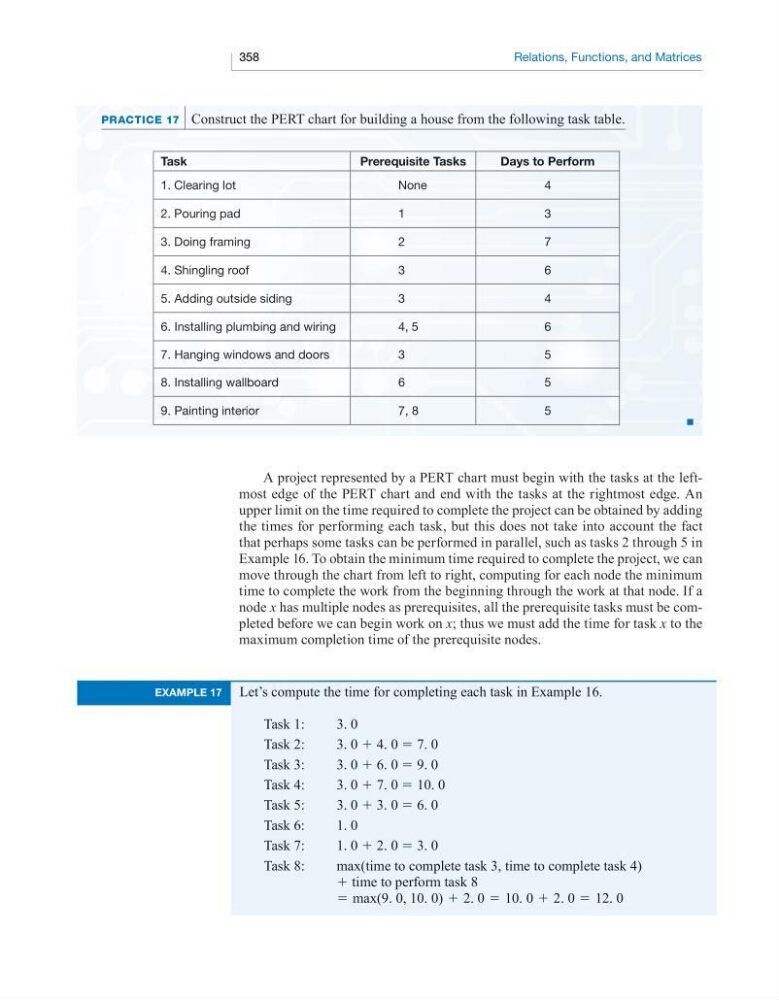
PRaCtiCe 17 Construct the PERT chart for building a house from the following task table.
task
prerequisite tasks
Days to perform
1. Clearing lot
None
4
2. Pouring pad
1
3
3. Doing framing
2
7
4. Shingling roof
3
6
5. Adding outside siding
3
4
6. Installing plumbing and wiring
4, 5
6
7. Hanging windows and doors
3
5
8. Installing wallboard
6
5
9. Painting interior
7, 8
5
■
example 17
Let’s compute the time for completing each task in Example 16.
Task 1:
3. 0
Task 2:
3. 0 + 4. 0 = 7. 0
Task 3:
3. 0 + 6. 0 = 9. 0
Task 4:
3. 0 + 7. 0 = 10. 0
Task 5:
3. 0 + 3. 0 = 6. 0
Task 6:
1. 0
Task 7:
1. 0 + 2. 0 = 3. 0
Task 8:
max(time to complete task 3, time to complete task 4)
+ time to perform task 8
= max(9. 0, 10. 0) + 2. 0 = 10. 0 + 2. 0 = 12. 0
Relations, Functions, and Matrices
A project represented by a PERT chart must begin with the tasks at the leftmost edge of the PERT chart and end with the tasks at the rightmost edge. An
upper limit on the time required to complete the project can be obtained by adding
the times for performing each task, but this does not take into account the fact
that perhaps some tasks can be performed in parallel, such as tasks 2 through 5 in
Example 16. To obtain the minimum time required to complete the project, we can
move through the chart from left to right, computing for each node the minimum
time to complete the work from the beginning through the work at that node. If a
node x has multiple nodes as prerequisites, all the prerequisite tasks must be completed before we can begin work on x; thus we must add the time for task x to the
maximum completion time of the prerequisite nodes.
PRaCtiCe 17 Construct the PERT chart for building a house from the following task table.
task
prerequisite tasks
Days to perform
1. Clearing lot
None
4
2. Pouring pad
1
3
3. Doing framing
2
7
4. Shingling roof
3
6
5. Adding outside siding
3
4
6. Installing plumbing and wiring
4, 5
6
7. Hanging windows and doors
3
5
8. Installing wallboard
6
5
9. Painting interior
7, 8
5
■
example 17
Let’s compute the time for completing each task in Example 16.
Task 1:
3. 0
Task 2:
3. 0 + 4. 0 = 7. 0
Task 3:
3. 0 + 6. 0 = 9. 0
Task 4:
3. 0 + 7. 0 = 10. 0
Task 5:
3. 0 + 3. 0 = 6. 0
Task 6:
1. 0
Task 7:
1. 0 + 2. 0 = 3. 0
Task 8:
max(time to complete task 3, time to complete task 4)
+ time to perform task 8
= max(9. 0, 10. 0) + 2. 0 = 10. 0 + 2. 0 = 12. 0