

29
Identification from Wearable Device Brain Signals
to use 5%, 15%, 25%, 50%, 75%, 85%, and 95% values to represent the histogram. Here
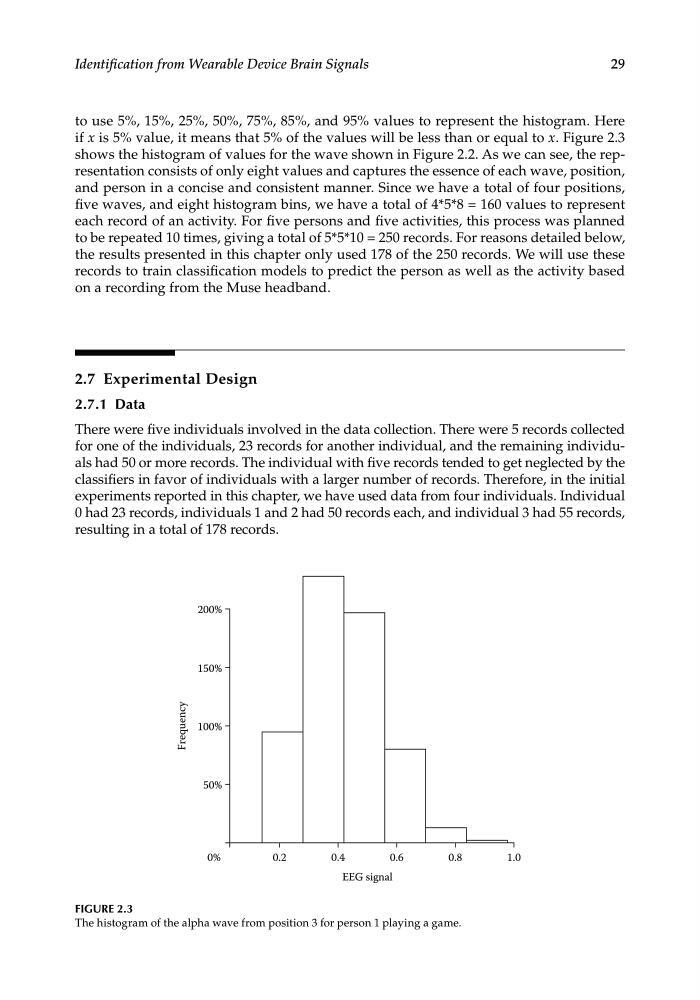
if x is 5% value, it means that 5% of the values will be less than or equal to x. Figure 2.3
shows the histogram of values for the wave shown in Figure 2.2. As we can see, the representation consists of only eight values and captures the essence of each wave, position,
and person in a concise and consistent manner. Since we have a total of four positions,
five waves, and eight histogram bins, we have a total of 4*5*8 = 160 values to represent
each record of an activity. For five persons and five activities, this process was planned
to be repeated 10 times, giving a total of 5*5*10 = 250 records. For reasons detailed below,
the results presented in this chapter only used 178 of the 250 records. We will use these
records to train classification models to predict the person as well as the activity based
on a recording from the Muse headband.
2.7 Experimental Design
2.7.1 Data
There were five individuals involved in the data collection. There were 5 records collected
for one of the individuals, 23 records for another individual, and the remaining individuals had 50 or more records. The individual with five records tended to get neglected by the
classifiers in favor of individuals with a larger number of records. Therefore, in the initial
experiments reported in this chapter, we have used data from four individuals. Individual
0 had 23 records, individuals 1 and 2 had 50 records each, and individual 3 had 55 records,
resulting in a total of 178 records.
0%
50%
100%
150%
200%
Frequency
0.2
0.4
EEG signal
0.6
0.8
1.0
FIGURE 2.3
The histogram of the alpha wave from position 3 for person 1 playing a game.
Identification from Wearable Device Brain Signals
to use 5%, 15%, 25%, 50%, 75%, 85%, and 95% values to represent the histogram. Here
if x is 5% value, it means that 5% of the values will be less than or equal to x. Figure 2.3
shows the histogram of values for the wave shown in Figure 2.2. As we can see, the representation consists of only eight values and captures the essence of each wave, position,
and person in a concise and consistent manner. Since we have a total of four positions,
five waves, and eight histogram bins, we have a total of 4*5*8 = 160 values to represent
each record of an activity. For five persons and five activities, this process was planned
to be repeated 10 times, giving a total of 5*5*10 = 250 records. For reasons detailed below,
the results presented in this chapter only used 178 of the 250 records. We will use these
records to train classification models to predict the person as well as the activity based
on a recording from the Muse headband.
2.7 Experimental Design
2.7.1 Data
There were five individuals involved in the data collection. There were 5 records collected
for one of the individuals, 23 records for another individual, and the remaining individuals had 50 or more records. The individual with five records tended to get neglected by the
classifiers in favor of individuals with a larger number of records. Therefore, in the initial
experiments reported in this chapter, we have used data from four individuals. Individual
0 had 23 records, individuals 1 and 2 had 50 records each, and individual 3 had 55 records,
resulting in a total of 178 records.
0%
50%
100%
150%
200%
Frequency
0.2
0.4
EEG signal
0.6
0.8
1.0
FIGURE 2.3
The histogram of the alpha wave from position 3 for person 1 playing a game.