

9
IoT-Enabled Vision System for Detection of Tint Level
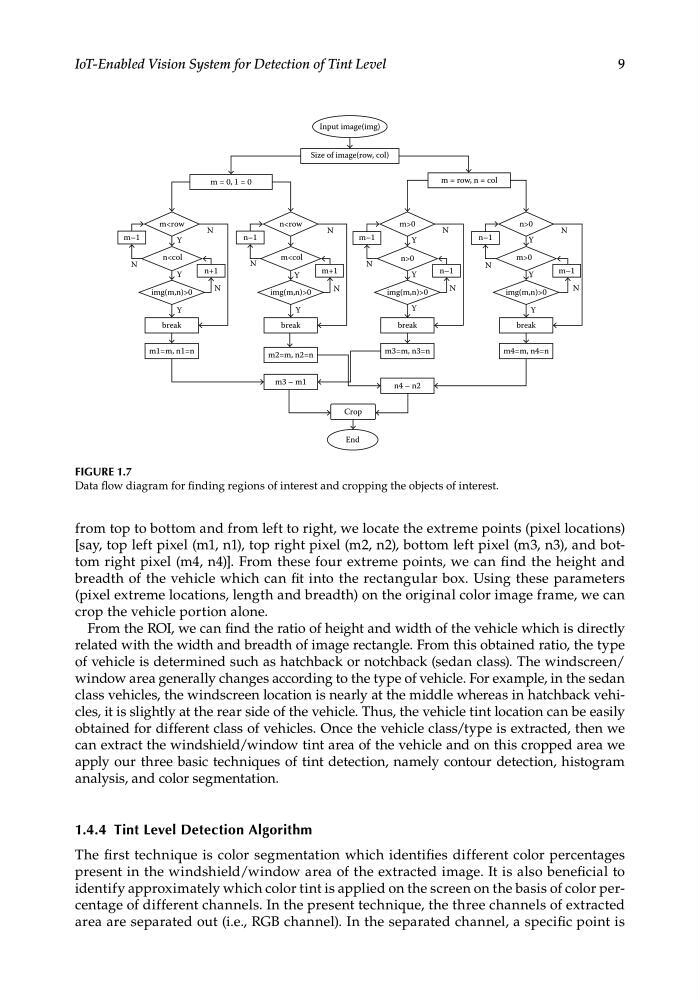
from top to bottom and from left to right, we locate the extreme points (pixel locations)
[say, top left pixel (m1, n1), top right pixel (m2, n2), bottom left pixel (m3, n3), and bottom right pixel (m4, n4)]. From these four extreme points, we can find the height and
breadth of the vehicle which can fit into the rectangular box. Using these parameters
(pixel extreme locations, length and breadth) on the original color image frame, we can
crop the vehicle portion alone.
From the ROI, we can find the ratio of height and width of the vehicle which is directly
related with the width and breadth of image rectangle. From this obtained ratio, the type
of vehicle is determined such as hatchback or notchback (sedan class). The windscreen/
window area generally changes according to the type of vehicle. For example, in the sedan
class vehicles, the windscreen location is nearly at the middle whereas in hatchback vehicles, it is slightly at the rear side of the vehicle. Thus, the vehicle tint location can be easily
obtained for different class of vehicles. Once the vehicle class/type is extracted, then we
can extract the windshield/window tint area of the vehicle and on this cropped area we
apply our three basic techniques of tint detection, namely contour detection, histogram
analysis, and color segmentation.
1.4.4 Tint Level Detection Algorithm
The first technique is color segmentation which identifies different color percentages
present in the windshield/window area of the extracted image. It is also beneficial to
identify approximately which color tint is applied on the screen on the basis of color percentage of different channels. In the present technique, the three channels of extracted
area are separated out (i.e., RGB channel). In the separated channel, a specific point is
Input image(img)
Size of image(row, col)
m = 0, 1 = 0
m
m+1
N
n+1
N
N
N
N
N
N
N
N
N
N
N
Y
Y
Y
Y
Y
Y
Y
Y
Y
Y
Y
n
break
m1=m, n1=n
break
m2=m, n2=n
m3 – m1
Crop
End
break
m3=m, n3=n
n4 – n2
m
n
m>0
n>0
n>0
img(m,n)>0
break
m4=m, n4=n
img(m,n)>0
n–1
n–1
m–1
n–1
m–1
m = row, n = col
FIGURE 1.7
Data flow diagram for finding regions of interest and cropping the objects of interest.
IoT-Enabled Vision System for Detection of Tint Level
from top to bottom and from left to right, we locate the extreme points (pixel locations)
[say, top left pixel (m1, n1), top right pixel (m2, n2), bottom left pixel (m3, n3), and bottom right pixel (m4, n4)]. From these four extreme points, we can find the height and
breadth of the vehicle which can fit into the rectangular box. Using these parameters
(pixel extreme locations, length and breadth) on the original color image frame, we can
crop the vehicle portion alone.
From the ROI, we can find the ratio of height and width of the vehicle which is directly
related with the width and breadth of image rectangle. From this obtained ratio, the type
of vehicle is determined such as hatchback or notchback (sedan class). The windscreen/
window area generally changes according to the type of vehicle. For example, in the sedan
class vehicles, the windscreen location is nearly at the middle whereas in hatchback vehicles, it is slightly at the rear side of the vehicle. Thus, the vehicle tint location can be easily
obtained for different class of vehicles. Once the vehicle class/type is extracted, then we
can extract the windshield/window tint area of the vehicle and on this cropped area we
apply our three basic techniques of tint detection, namely contour detection, histogram
analysis, and color segmentation.
1.4.4 Tint Level Detection Algorithm
The first technique is color segmentation which identifies different color percentages
present in the windshield/window area of the extracted image. It is also beneficial to
identify approximately which color tint is applied on the screen on the basis of color percentage of different channels. In the present technique, the three channels of extracted
area are separated out (i.e., RGB channel). In the separated channel, a specific point is
Input image(img)
Size of image(row, col)
m = 0, 1 = 0
m
m+1
N
n+1
N
N
N
N
N
N
N
N
N
N
N
Y
Y
Y
Y
Y
Y
Y
Y
Y
Y
Y
n
break
m1=m, n1=n
break
m2=m, n2=n
m3 – m1
Crop
End
break
m3=m, n3=n
n4 – n2
m
n
m>0
n>0
n>0
img(m,n)>0
break
m4=m, n4=n
img(m,n)>0
n–1
n–1
m–1
n–1
m–1
m = row, n = col
FIGURE 1.7
Data flow diagram for finding regions of interest and cropping the objects of interest.