

Sustainability of Concrete Structures in Terms …
71
the remaining 8 test cylinders (4 from each concrete) were placed in the KD-20 automatic freezing box, where they were subjected to 25 F-T cycles described above.
After the specimens were removed from the freezing box, V and f L were determined
again for all the specimens and tensile splitting strength for half of them (2 specimens from each concrete). The remaining cylinders were subjected to another 25
F-T cycles, after which the monitored parameters were determined again.
5 Results and Discussion
The values obtained for the ultrasonic pulse velocity V were used to calculate the
relative dynamic modulus of elasticity RDM(U) and the determined natural longitudinal vibration frequencies f L were used to calculate the relative dynamic modulus
of elasticity RDM(FL). The calculation of RDM was based on [16]. All the results
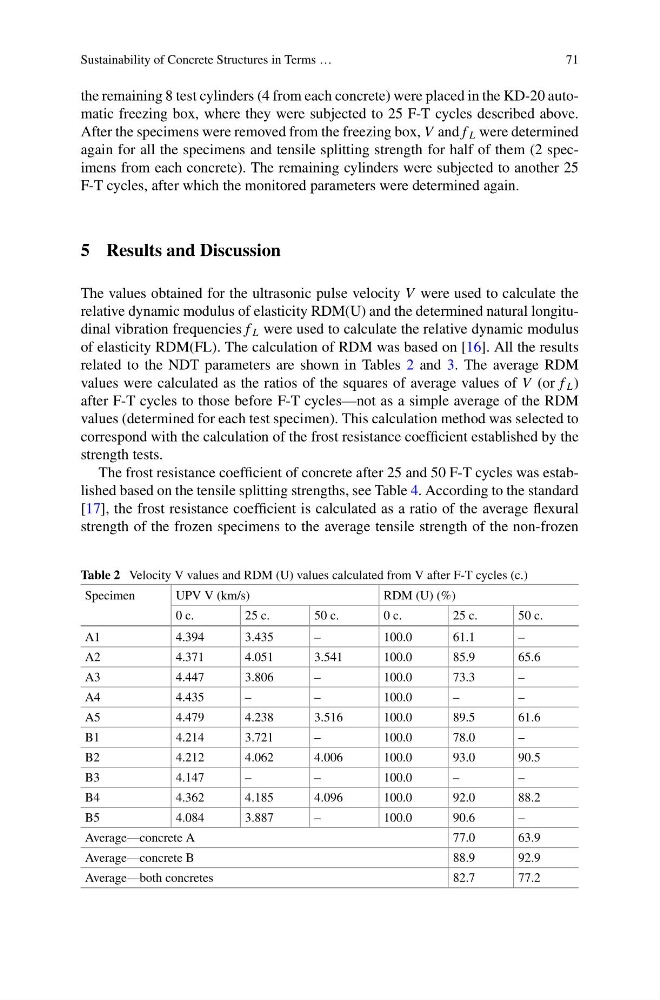
related to the NDT parameters are shown in Tables 2 and 3. The average RDM
values were calculated as the ratios of the squares of average values of V (or f L )
after F-T cycles to those before F-T cycles—not as a simple average of the RDM
values (determined for each test specimen). This calculation method was selected to
correspond with the calculation of the frost resistance coefficient established by the
strength tests.
The frost resistance coefficient of concrete after 25 and 50 F-T cycles was established based on the tensile splitting strengths, see Table 4. According to the standard
[17], the frost resistance coefficient is calculated as a ratio of the average flexural
strength of the frozen specimens to the average tensile strength of the non-frozen
Table 2 Velocity V values and RDM (U) values calculated from V after F-T cycles (c.)
Specimen
UPV V (km/s)
RDM (U) (%)
0 c.
25 c.
50 c.
0 c.
25 c.
50 c.
A1
4.394
3.435
–
100.0
61.1
–
A2
4.371
4.051
3.541
100.0
85.9
65.6
A3
4.447
3.806
–
100.0
73.3
–
A4
4.435
–
–
100.0
–
–
A5
4.479
4.238
3.516
100.0
89.5
61.6
B1
4.214
3.721
–
100.0
78.0
–
B2
4.212
4.062
4.006
100.0
93.0
90.5
B3
4.147
–
–
100.0
–
–
B4
4.362
4.185
4.096
100.0
92.0
88.2
B5
4.084
3.887
–
100.0
90.6
–
Average—concrete A
77.0
63.9
Average—concrete B
88.9
92.9
Average—both concretes
82.7
77.2
71
the remaining 8 test cylinders (4 from each concrete) were placed in the KD-20 automatic freezing box, where they were subjected to 25 F-T cycles described above.
After the specimens were removed from the freezing box, V and f L were determined
again for all the specimens and tensile splitting strength for half of them (2 specimens from each concrete). The remaining cylinders were subjected to another 25
F-T cycles, after which the monitored parameters were determined again.
5 Results and Discussion
The values obtained for the ultrasonic pulse velocity V were used to calculate the
relative dynamic modulus of elasticity RDM(U) and the determined natural longitudinal vibration frequencies f L were used to calculate the relative dynamic modulus
of elasticity RDM(FL). The calculation of RDM was based on [16]. All the results
related to the NDT parameters are shown in Tables 2 and 3. The average RDM
values were calculated as the ratios of the squares of average values of V (or f L )
after F-T cycles to those before F-T cycles—not as a simple average of the RDM
values (determined for each test specimen). This calculation method was selected to
correspond with the calculation of the frost resistance coefficient established by the
strength tests.
The frost resistance coefficient of concrete after 25 and 50 F-T cycles was established based on the tensile splitting strengths, see Table 4. According to the standard
[17], the frost resistance coefficient is calculated as a ratio of the average flexural
strength of the frozen specimens to the average tensile strength of the non-frozen
Table 2 Velocity V values and RDM (U) values calculated from V after F-T cycles (c.)
Specimen
UPV V (km/s)
RDM (U) (%)
0 c.
25 c.
50 c.
0 c.
25 c.
50 c.
A1
4.394
3.435
–
100.0
61.1
–
A2
4.371
4.051
3.541
100.0
85.9
65.6
A3
4.447
3.806
–
100.0
73.3
–
A4
4.435
–
–
100.0
–
–
A5
4.479
4.238
3.516
100.0
89.5
61.6
B1
4.214
3.721
–
100.0
78.0
–
B2
4.212
4.062
4.006
100.0
93.0
90.5
B3
4.147
–
–
100.0
–
–
B4
4.362
4.185
4.096
100.0
92.0
88.2
B5
4.084
3.887
–
100.0
90.6
–
Average—concrete A
77.0
63.9
Average—concrete B
88.9
92.9
Average—both concretes
82.7
77.2