

40
K. Jurasz-Drozdowska and W. Radomski
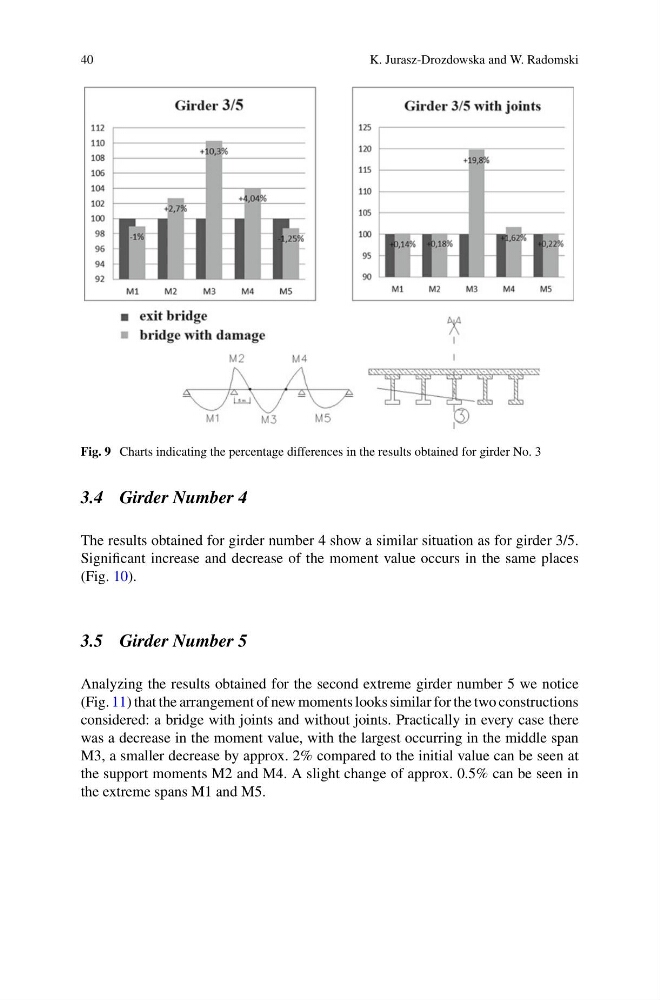
Fig. 9 Charts indicating the percentage differences in the results obtained for girder No. 3
3.4 Girder Number 4
The results obtained for girder number 4 show a similar situation as for girder 3/5.
Significant increase and decrease of the moment value occurs in the same places
(Fig. 10).
3.5 Girder Number 5
Analyzing the results obtained for the second extreme girder number 5 we notice
(Fig. 11) that the arrangement of new moments looks similar for the two constructions
considered: a bridge with joints and without joints. Practically in every case there
was a decrease in the moment value, with the largest occurring in the middle span
M3, a smaller decrease by approx. 2% compared to the initial value can be seen at
the support moments M2 and M4. A slight change of approx. 0.5% can be seen in
the extreme spans M1 and M5.
K. Jurasz-Drozdowska and W. Radomski
Fig. 9 Charts indicating the percentage differences in the results obtained for girder No. 3
3.4 Girder Number 4
The results obtained for girder number 4 show a similar situation as for girder 3/5.
Significant increase and decrease of the moment value occurs in the same places
(Fig. 10).
3.5 Girder Number 5
Analyzing the results obtained for the second extreme girder number 5 we notice
(Fig. 11) that the arrangement of new moments looks similar for the two constructions
considered: a bridge with joints and without joints. Practically in every case there
was a decrease in the moment value, with the largest occurring in the middle span
M3, a smaller decrease by approx. 2% compared to the initial value can be seen at
the support moments M2 and M4. A slight change of approx. 0.5% can be seen in
the extreme spans M1 and M5.