

76
Practical MATLAB
® Applications for Engineers
Example 1.15
Let the discrete sequence
f(n) = 4n0.8
n u(n)
be contaminated by a random noisy signal with a magnitude less than 1.
Create the script fi le averages that returns the following plots:
a. f(n) versus n
b. noise signal[n(t)] versus n
c. [f(n) + n(t)] versus n
d. [f(n) + n(t)] moving average using two terms versus n
e. [f(n) + n(t)] moving average using three terms versus n
f. [f(n) + n(t)] moving average using four terms versus n
g. Estimate the best moving average approximation for [f(n) + n(t)] versus n, by executing the script fi le at least three times and observing and recording the results
Where the L point moving average is defi ned by
{
}
(
)
moving aver. L
L
f n k
k
L
ϭ
Ϫ
ϭ
Ϫ
1
0
1
∑
for L = 2, 3, and 4, over the range 0 ≤ n ≤ 20.
MATLAB Solution
% Script file: averages
n = 0:1:20;
figure(1)
subplot(3,1,1)
signal = 4.*n.*(.8.^n);stem(n,signal);hold on;
plot(n,signal,n,signal,’o’);
title(‘Signal vs. n’)
ylabel(‘Amplitude’);xlabel(‘time index n’);
subplot(3,1,2)
noise = 2.*rand(1,21)-1.0;y = zeros(1,21);
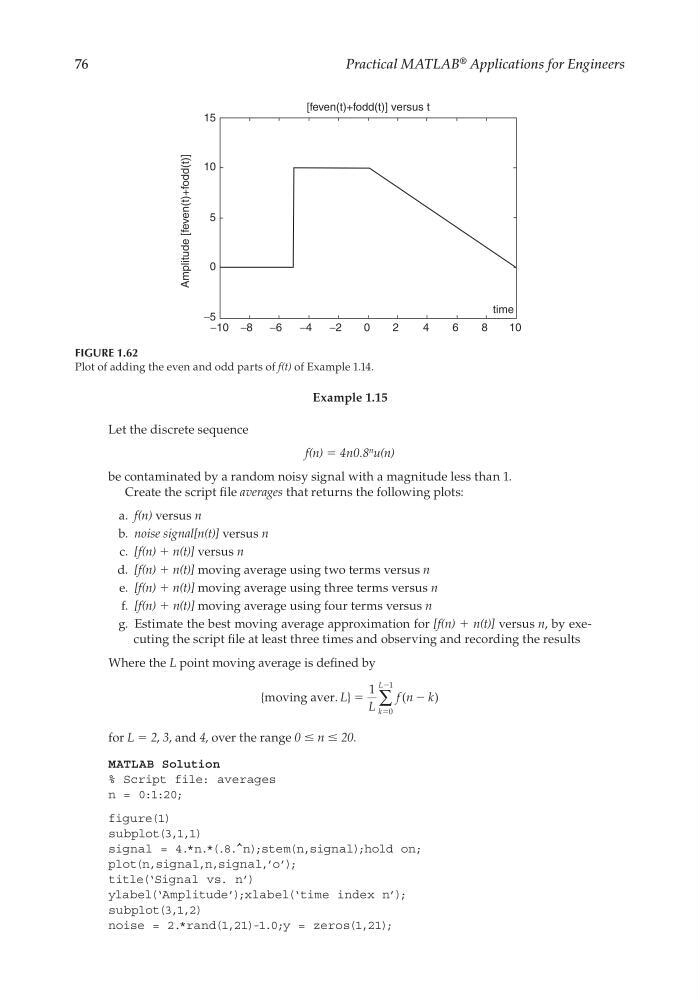
FIGURE 1.62
Plot of adding the even and odd parts of f(t) of Example 1.14.
[feven(t)+fodd(t)] versus t
15
10
5
0
−5
Amplitude [feven(t)+fodd(t)]
−10 −8
−6
−4
−2
0
2
4
6
8
10
time
CRC_47760_CH001.indd 76
CRC_47760_CH001.indd 76
7/25/2008 4:16:25 PM
7/25/2008 4:16:25 PM
Practical MATLAB
® Applications for Engineers
Example 1.15
Let the discrete sequence
f(n) = 4n0.8
n u(n)
be contaminated by a random noisy signal with a magnitude less than 1.
Create the script fi le averages that returns the following plots:
a. f(n) versus n
b. noise signal[n(t)] versus n
c. [f(n) + n(t)] versus n
d. [f(n) + n(t)] moving average using two terms versus n
e. [f(n) + n(t)] moving average using three terms versus n
f. [f(n) + n(t)] moving average using four terms versus n
g. Estimate the best moving average approximation for [f(n) + n(t)] versus n, by executing the script fi le at least three times and observing and recording the results
Where the L point moving average is defi ned by
{
}
(
)
moving aver. L
L
f n k
k
L
ϭ
Ϫ
ϭ
Ϫ
1
0
1
∑
for L = 2, 3, and 4, over the range 0 ≤ n ≤ 20.
MATLAB Solution
% Script file: averages
n = 0:1:20;
figure(1)
subplot(3,1,1)
signal = 4.*n.*(.8.^n);stem(n,signal);hold on;
plot(n,signal,n,signal,’o’);
title(‘Signal vs. n’)
ylabel(‘Amplitude’);xlabel(‘time index n’);
subplot(3,1,2)
noise = 2.*rand(1,21)-1.0;y = zeros(1,21);
FIGURE 1.62
Plot of adding the even and odd parts of f(t) of Example 1.14.
[feven(t)+fodd(t)] versus t
15
10
5
0
−5
Amplitude [feven(t)+fodd(t)]
−10 −8
−6
−4
−2
0
2
4
6
8
10
time
CRC_47760_CH001.indd 76
CRC_47760_CH001.indd 76
7/25/2008 4:16:25 PM
7/25/2008 4:16:25 PM