

74
Practical MATLAB
® Applications for Engineers
Create the script fi le even_odd that returns, using 201 points over the range −10 ≤ t ≤ 10,
the following:
a. Plots of f(t) versus t, f e (t)* versus t, and f o (t) versus t
b. Verifi es graphically that f(t) = f e (t) + f o (t)
c. The energies of f(t), f e (t), and f o (t)
d. Verifi es that the energy {f(t)} = energy{f e (t)} + energy{f o (t)}
MATLAB Solution
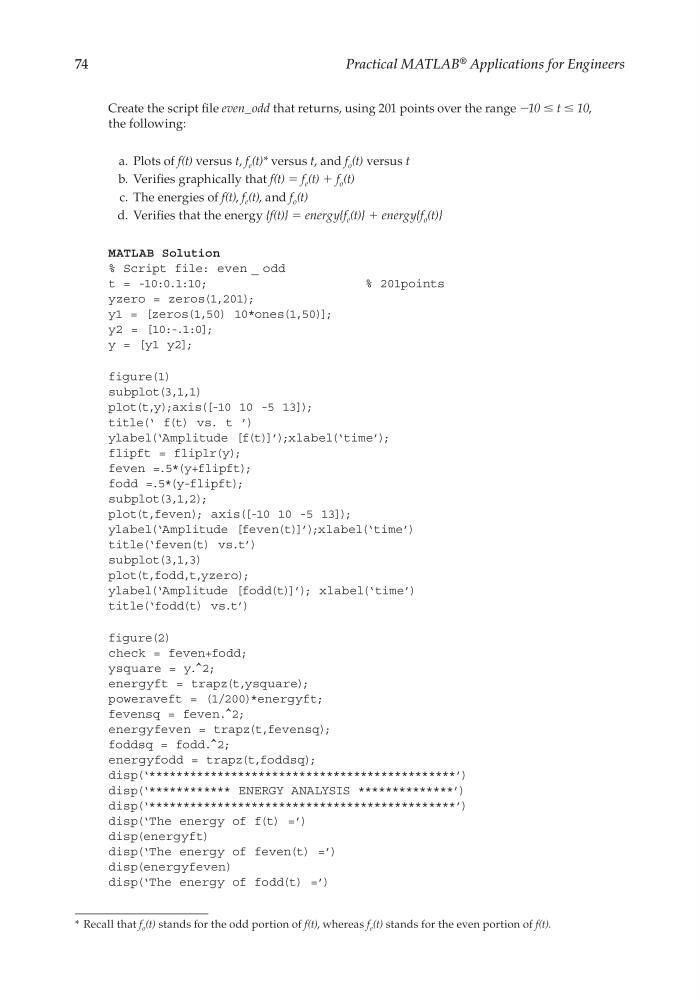
% Script file: even _ odd
t = -10:0.1:10;
% 201points
yzero = zeros(1,201);
y1 = [zeros(1,50) 10*ones(1,50)];
y2 = [10:-.1:0];
y = [y1 y2];
figure(1)
subplot(3,1,1)
plot(t,y);axis([-10 10 -5 13]);
title(‘ f(t) vs. t ’)
ylabel(‘Amplitude [f(t)]’);xlabel(‘time’);
flipft = fliplr(y);
feven =.5*(y+flipft);
fodd =.5*(y-flipft);
subplot(3,1,2);
plot(t,feven); axis([-10 10 -5 13]);
ylabel(‘Amplitude [feven(t)]’);xlabel(‘time’)
title(‘feven(t) vs.t’)
subplot(3,1,3)
plot(t,fodd,t,yzero);
ylabel(‘Amplitude [fodd(t)]’); xlabel(‘time’)
title(‘fodd(t) vs.t’)
figure(2)
check = feven+fodd;
ysquare = y.^2;
energyft = trapz(t,ysquare);
poweraveft = (1/200)*energyft;
fevensq = feven.^2;
energyfeven = trapz(t,fevensq);
foddsq = fodd.^2;
energyfodd = trapz(t,foddsq);
disp(‘*********************************************’)
disp(‘************ ENERGY ANALYSIS **************’)
disp(‘*********************************************’)
disp(‘The energy of f(t) =’)
disp(energyft)
disp(‘The energy of feven(t) =’)
disp(energyfeven)
disp(‘The energy of fodd(t) =’)
* Recall that f o (t) stands for the odd portion of f(t), whereas f e (t) stands for the even portion of f(t).
CRC_47760_CH001.indd 74
CRC_47760_CH001.indd 74
7/25/2008 4:16:25 PM
7/25/2008 4:16:25 PM
Practical MATLAB
® Applications for Engineers
Create the script fi le even_odd that returns, using 201 points over the range −10 ≤ t ≤ 10,
the following:
a. Plots of f(t) versus t, f e (t)* versus t, and f o (t) versus t
b. Verifi es graphically that f(t) = f e (t) + f o (t)
c. The energies of f(t), f e (t), and f o (t)
d. Verifi es that the energy {f(t)} = energy{f e (t)} + energy{f o (t)}
MATLAB Solution
% Script file: even _ odd
t = -10:0.1:10;
% 201points
yzero = zeros(1,201);
y1 = [zeros(1,50) 10*ones(1,50)];
y2 = [10:-.1:0];
y = [y1 y2];
figure(1)
subplot(3,1,1)
plot(t,y);axis([-10 10 -5 13]);
title(‘ f(t) vs. t ’)
ylabel(‘Amplitude [f(t)]’);xlabel(‘time’);
flipft = fliplr(y);
feven =.5*(y+flipft);
fodd =.5*(y-flipft);
subplot(3,1,2);
plot(t,feven); axis([-10 10 -5 13]);
ylabel(‘Amplitude [feven(t)]’);xlabel(‘time’)
title(‘feven(t) vs.t’)
subplot(3,1,3)
plot(t,fodd,t,yzero);
ylabel(‘Amplitude [fodd(t)]’); xlabel(‘time’)
title(‘fodd(t) vs.t’)
figure(2)
check = feven+fodd;
ysquare = y.^2;
energyft = trapz(t,ysquare);
poweraveft = (1/200)*energyft;
fevensq = feven.^2;
energyfeven = trapz(t,fevensq);
foddsq = fodd.^2;
energyfodd = trapz(t,foddsq);
disp(‘*********************************************’)
disp(‘************ ENERGY ANALYSIS **************’)
disp(‘*********************************************’)
disp(‘The energy of f(t) =’)
disp(energyft)
disp(‘The energy of feven(t) =’)
disp(energyfeven)
disp(‘The energy of fodd(t) =’)
* Recall that f o (t) stands for the odd portion of f(t), whereas f e (t) stands for the even portion of f(t).
CRC_47760_CH001.indd 74
CRC_47760_CH001.indd 74
7/25/2008 4:16:25 PM
7/25/2008 4:16:25 PM