

20
10
−10
−20
0
0
0.5
1
2
2.5
1.5
3
3.5
4
5
4.5
0
0
5
10
−10
−5
0.5
1
2
2.5
1.5
3
3.5
4
5
4.5
time (sec)
Amplitude (amps/volts)
Amplitude (amps/volts)
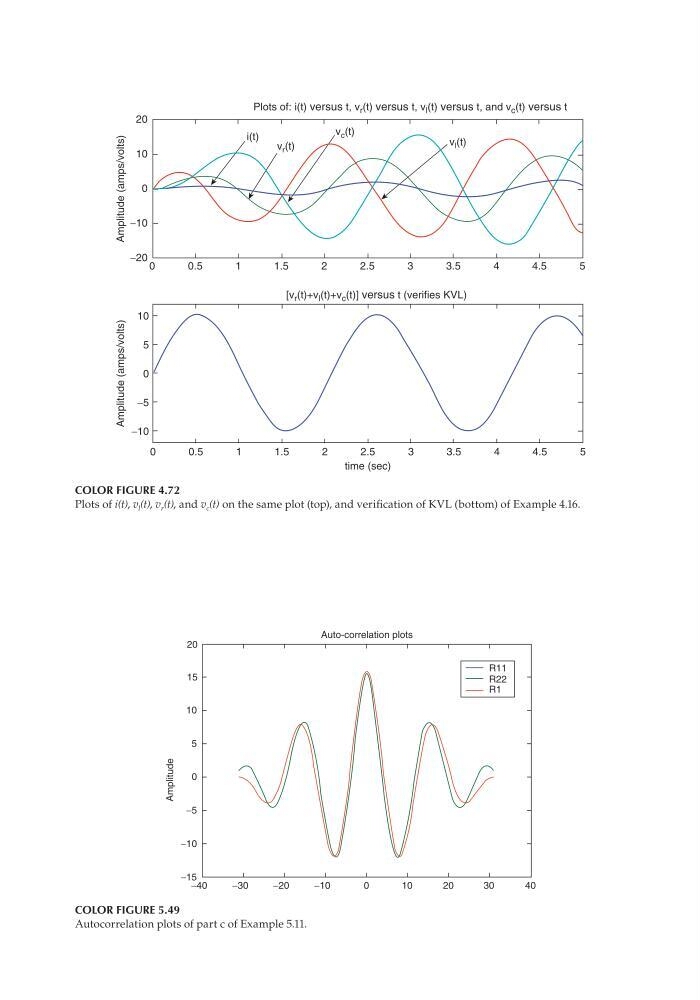
Plots of: i(t) versus t, v r (t) versus t, v l (t) versus t, and v c (t) versus t
[v r (t)+v l (t)+v c (t)] versus t (verifies KVL)
i(t)
v r (t)
v c (t)
v l (t)
COLOR FIGURE 4.72
Plots of i(t), v l (t), v r (t), and v c (t) on the same plot (top), and verifi cation of KVL (bottom) of Example 4.16.
−15
−40
−30
−20
−10
0
10
20
30
40
−10
−5
0
Amplitude
5
10
15
20
Auto-correlation plots
R11
R22
R1
COLOR FIGURE 5.49
Autocorrelation plots of part c of Example 5.11.
CRC_47760_COLPLA.indd 7
CRC_47760_COLPLA.indd 7
7/18/2008 5:34:24 PM
7/18/2008 5:34:24 PM
10
−10
−20
0
0
0.5
1
2
2.5
1.5
3
3.5
4
5
4.5
0
0
5
10
−10
−5
0.5
1
2
2.5
1.5
3
3.5
4
5
4.5
time (sec)
Amplitude (amps/volts)
Amplitude (amps/volts)
Plots of: i(t) versus t, v r (t) versus t, v l (t) versus t, and v c (t) versus t
[v r (t)+v l (t)+v c (t)] versus t (verifies KVL)
i(t)
v r (t)
v c (t)
v l (t)
COLOR FIGURE 4.72
Plots of i(t), v l (t), v r (t), and v c (t) on the same plot (top), and verifi cation of KVL (bottom) of Example 4.16.
−15
−40
−30
−20
−10
0
10
20
30
40
−10
−5
0
Amplitude
5
10
15
20
Auto-correlation plots
R11
R22
R1
COLOR FIGURE 5.49
Autocorrelation plots of part c of Example 5.11.
CRC_47760_COLPLA.indd 7
CRC_47760_COLPLA.indd 7
7/18/2008 5:34:24 PM
7/18/2008 5:34:24 PM