

Spectrogram of the speech file mtlb
1
0.8
0.6
0.4
0.2
0
0
Frequency
500
1000
1500
Time
Specgram of sinusoid + noise
1
0.8
0.6
0.4
0.2
0
Frequency
0
500
1000
1500
Time
Power spec. den. of mtlb
Frequency
Power spec. den. of sinus. + noise
20
−20
−40
−60
0
0
0.5
1
Power spectrum magnitude (dB)
30
20
10
0
0
0.5
1
−10
Frequency
Power spectrum magnitude (dB)
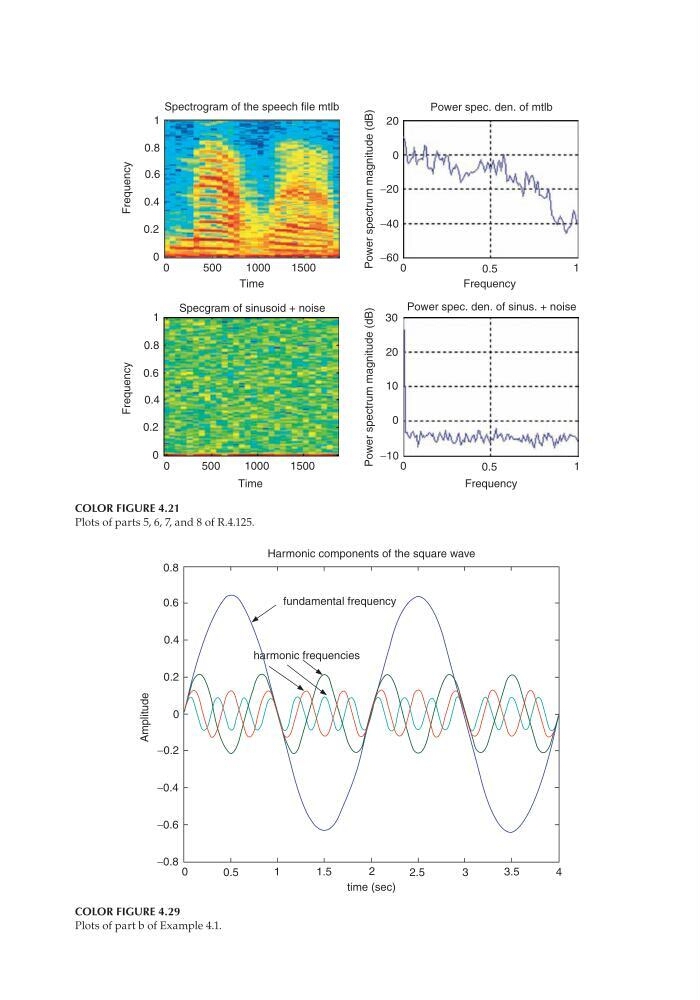
COLOR FIGURE 4.21
Plots of parts 5, 6, 7, and 8 of R.4.125.
0.8
0.6
0.4
0.2
0
−0.2
−0.4
−0.6
−0.8
0
0.5
1
1.5
2
2.5
3
3.5
4
time (sec)
fundamental frequency
harmonic frequencies
Amplitude
Harmonic components of the square wave
COLOR FIGURE 4.29
Plots of part b of Example 4.1.
CRC_47760_COLPLA.indd 4
CRC_47760_COLPLA.indd 4
7/18/2008 5:34:23 PM
7/18/2008 5:34:23 PM
1
0.8
0.6
0.4
0.2
0
0
Frequency
500
1000
1500
Time
Specgram of sinusoid + noise
1
0.8
0.6
0.4
0.2
0
Frequency
0
500
1000
1500
Time
Power spec. den. of mtlb
Frequency
Power spec. den. of sinus. + noise
20
−20
−40
−60
0
0
0.5
1
Power spectrum magnitude (dB)
30
20
10
0
0
0.5
1
−10
Frequency
Power spectrum magnitude (dB)
COLOR FIGURE 4.21
Plots of parts 5, 6, 7, and 8 of R.4.125.
0.8
0.6
0.4
0.2
0
−0.2
−0.4
−0.6
−0.8
0
0.5
1
1.5
2
2.5
3
3.5
4
time (sec)
fundamental frequency
harmonic frequencies
Amplitude
Harmonic components of the square wave
COLOR FIGURE 4.29
Plots of part b of Example 4.1.
CRC_47760_COLPLA.indd 4
CRC_47760_COLPLA.indd 4
7/18/2008 5:34:23 PM
7/18/2008 5:34:23 PM