

624
Practical MATLAB
® Applications for Engineers
phase3=angle(h3);
subplot(1,3,3);
plot(w,phase3);axis([0 3 -2 2]);
xlabel(‘freq w(rad/sec)’);
ylabel(‘phase in rad’);
title(‘Chebyshev 2, phase plot’)
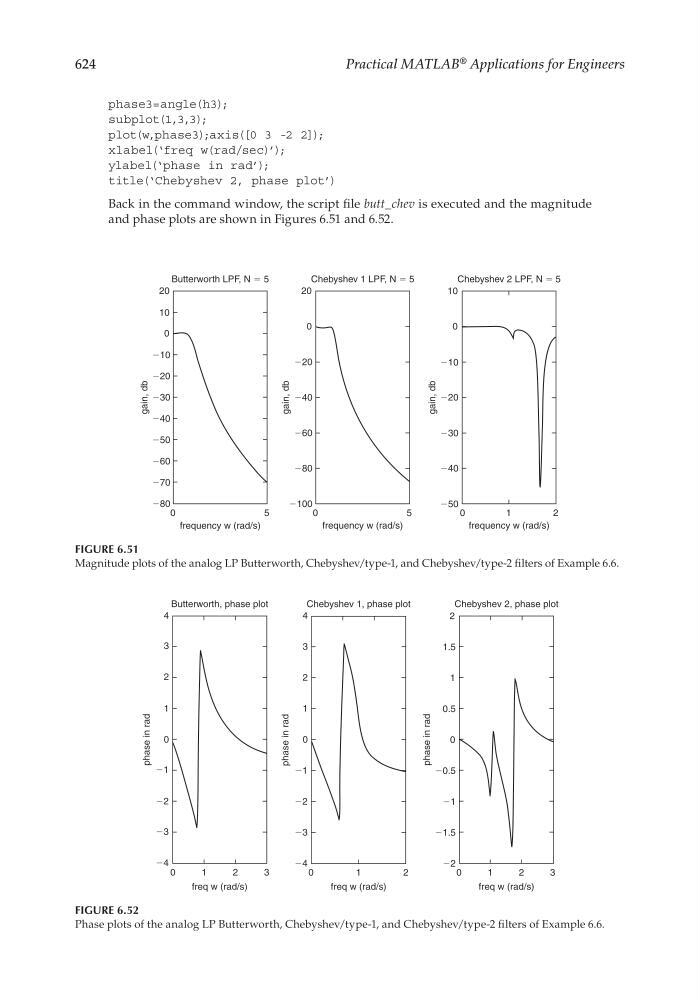
Back in the command window, the script fi le butt_chev is executed and the magnitude
and phase plots are shown in Figures 6.51 and 6.52.
FIGURE 6.51
Magnitude plots of the analog LP Butterworth, Chebyshev/type-1, and Chebyshev/type-2 fi lters of Example 6.6.
20
Butterworth LPF, N ϭ 5
10
Ϫ10
Ϫ20
Ϫ30
Ϫ40
Ϫ50
Ϫ60
Ϫ70
Ϫ80
0
5
frequency w (rad/s)
0
gain, db
0
5
frequency w (rad/s)
20
Chebyshev 1 LPF, N ϭ 5
Ϫ20
Ϫ40
Ϫ60
Ϫ80
Ϫ100
0
gain, db
0
1
2
frequency w (rad/s)
Chebyshev 2 LPF, N ϭ 5
10
Ϫ10
Ϫ20
Ϫ30
Ϫ40
Ϫ50
0
gain, db
FIGURE 6.52
Phase plots of the analog LP Butterworth, Chebyshev/type-1, and Chebyshev/type-2 fi lters of Example 6.6.
Butterworth, phase plot
4
3
2
1
phase in rad
0
Ϫ1
Ϫ2
Ϫ3
Ϫ4
1
0
2
3
freq w (rad/s)
Chebyshev 1, phase plot
4
3
2
1
phase in rad
0
Ϫ1
Ϫ2
Ϫ3
Ϫ4
0
1
2
freq w (rad/s)
Chebyshev 2, phase plot
2
1.5
1
0.5
0
Ϫ1
Ϫ2
phase in rad
0
3
1
2
freq w (rad/s)
Ϫ0.5
Ϫ1.5
CRC_47760_CH006.indd 624
CRC_47760_CH006.indd 624
7/23/2008 2:26:51 PM
7/23/2008 2:26:51 PM