

622
Practical MATLAB
® Applications for Engineers
Example 6.6
Create the script fi le butt_chev that returns the magnitude and phase plots of the following analog LPFs:
a. Butterworth
b. Chebyshev/type 1
c. Chebyshev/type 2
with the following fi lter’s specs:
1. The fi lter’s order of N = 5
2. Pass-band edge at W p = 1 rad/s
3. Pass-band ripple of R p = 1 dB
4. Stop-band ripple of R s = 1 dB
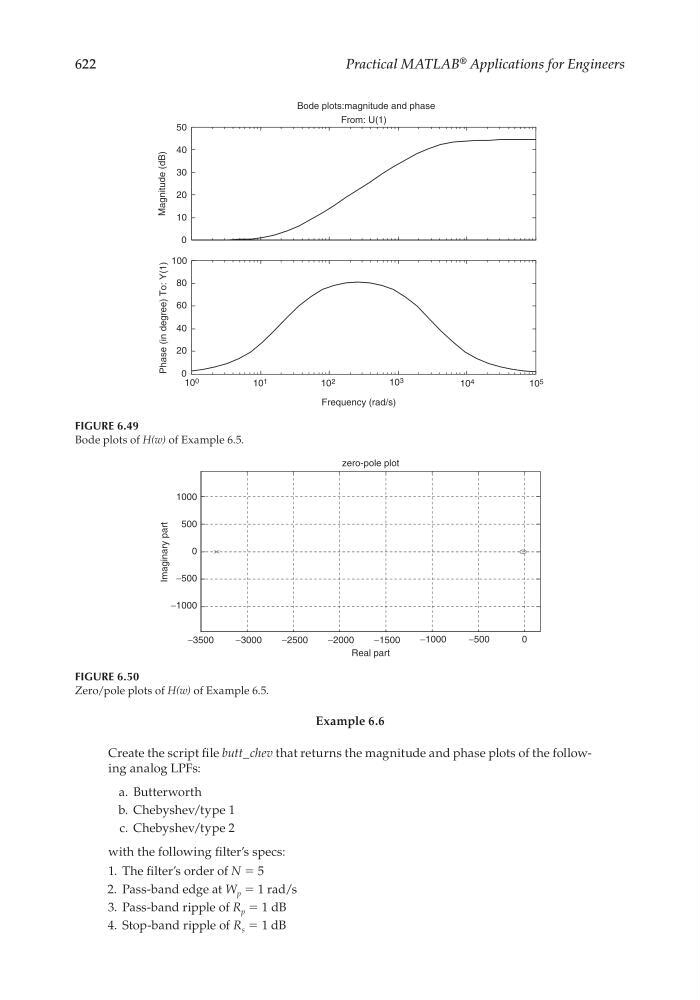
FIGURE 6.49
Bode plots of H(w) of Example 6.5.
Frequency (rad/s)
Phase (in degree) To: Y(1)
Bode plots:magnitude and phase
0
10
20
30
40
50
From: U(1)
10 4
10 3
10 2
10 1
10 0
10 5
0
20
40
60
80
100
Magnitude (dB)
FIGURE 6.50
Zero/pole plots of H(w) of Example 6.5.
−3500
−3000
−2500
−2000
−1500
−1000
−500
0
−1000
−500
0
500
1000
Real part
Imaginary part
zero-pole plot
CRC_47760_CH006.indd 622
CRC_47760_CH006.indd 622
7/23/2008 2:26:50 PM
7/23/2008 2:26:50 PM