

616
Practical MATLAB
® Applications for Engineers
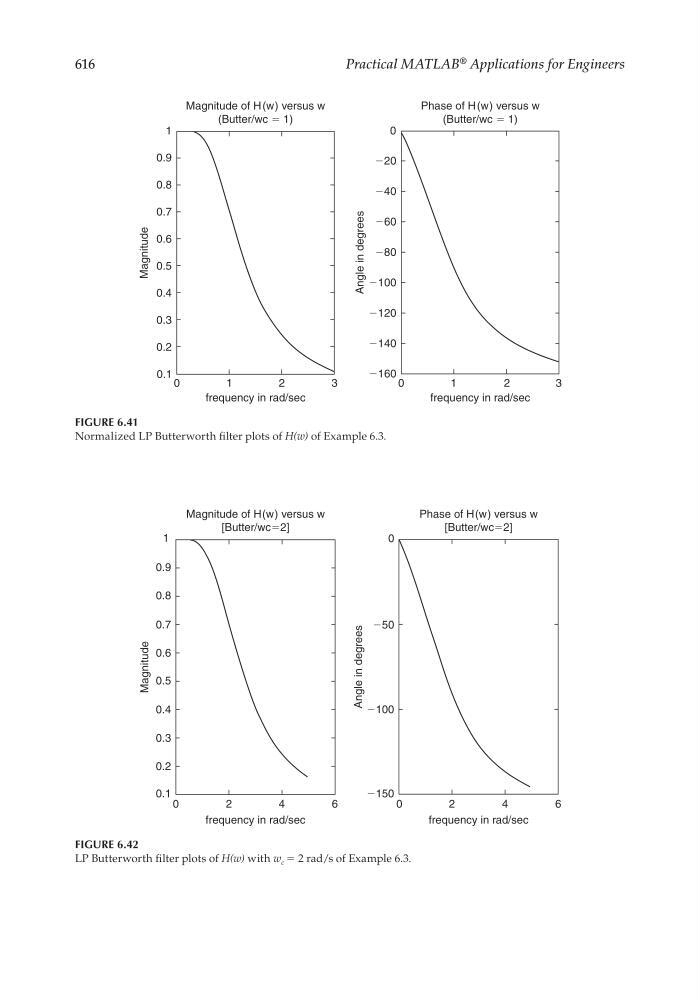
FIGURE 6.41
Normalized LP Butterworth fi lter plots of H(w) of Example 6.3.
Phase of H (w) versus w
(Butter/wc ϭ 1)
0
Ϫ20
Ϫ40
Ϫ80
Angle in degrees
Ϫ60
Ϫ100
Ϫ120
Ϫ140
Ϫ160
0
1
2
3
frequency in rad/sec
Magnitude of H (w) versus w
(Butter/wc ϭ 1)
1
0.8
0.9
0.7
0.6
0.5
0.4
0.3
0.2
0.1
0
1
2
3
frequency in rad/sec
Magnitude
FIGURE 6.42
LP Butterworth fi lter plots of H(w) with w c = 2 rad/s of Example 6.3.
Phase of H(w) versus w
[Butter/wcϭ2]
Ϫ50
0
Angle in degrees
Ϫ100
Ϫ150
0
6
2
4
frequency in rad/sec
Magnitude of H(w) versus w
[Butter/wcϭ2]
1
0.8
0.9
0.7
0.6
0.5
0.4
0.3
0.2
0.1
0
4
2
6
frequency in rad/sec
Magnitude
CRC_47760_CH006.indd 616
CRC_47760_CH006.indd 616
7/23/2008 2:26:47 PM
7/23/2008 2:26:47 PM