

Time Domain Representation of Continuous and Discrete Signals
39
R.1.118 As an additional example, create the script fi le triang_pulses that returns the plots
of triangular waves with 3, 4, 5, and 2 cycles, respectively, and unit magnitude,
over the range 0 ≤ t ≤ 1.
MATLAB Solution
% Script file: triang _ pulses
% echo on
t =0:0.001:1;
subplot(2,2,1)
d1 = [0:.33:1];
% 3 cycles
y1 = pulstran(t,d1,’tripuls’,.25);
plot (t,y1)
title (‘3 triangular cycles’);
axis ([0 1 -0.5 1.5]);
ylabel(‘Amplitude’) ;
subplot(2,2,2)
da = [0:.25:1];
y2 = pulstran(t,da,’tripuls’,.25);
% 4 cycles
plot(t,y2);
title(‘4 triangular cycles’);
axis([0 1 -0.5 1.5]);
ylabel(‘Amplitude’) ;
subplot(2,2,3)
d3 = [0:.20:1];
% 5 cycles
y3 = pulstran(t,d3,’tripuls’,.1);
plot(t,y3);
title(‘5 triangular cycles’);
axis ([0 1 -0.5 1.5]);
xlabel(‘time’)
ylabel(‘Amplitude’) ;
d4 = [0:.5:1];
% 2 cycles
subplot(2,2,4)
y4 = pulstran(t,d4,’tripuls’,.4);
plot (t,y4)
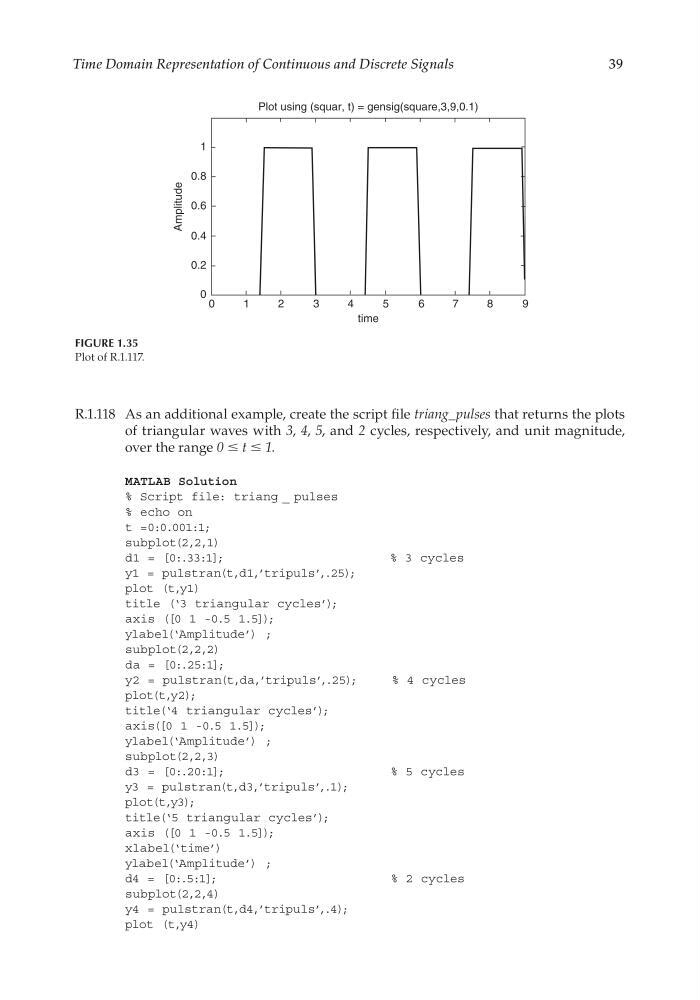
Plot using (squar, t) = gensig(square,3,9,0.1)
1
0.8
Amplitude
0.6
0.4
0.2
0
0
1
2
3
4
5
6
7
8
9
time
FIGURE 1.35
Plot of R.1.117.
CRC_47760_CH001.indd 39
CRC_47760_CH001.indd 39
7/25/2008 4:16:18 PM
7/25/2008 4:16:18 PM
39
R.1.118 As an additional example, create the script fi le triang_pulses that returns the plots
of triangular waves with 3, 4, 5, and 2 cycles, respectively, and unit magnitude,
over the range 0 ≤ t ≤ 1.
MATLAB Solution
% Script file: triang _ pulses
% echo on
t =0:0.001:1;
subplot(2,2,1)
d1 = [0:.33:1];
% 3 cycles
y1 = pulstran(t,d1,’tripuls’,.25);
plot (t,y1)
title (‘3 triangular cycles’);
axis ([0 1 -0.5 1.5]);
ylabel(‘Amplitude’) ;
subplot(2,2,2)
da = [0:.25:1];
y2 = pulstran(t,da,’tripuls’,.25);
% 4 cycles
plot(t,y2);
title(‘4 triangular cycles’);
axis([0 1 -0.5 1.5]);
ylabel(‘Amplitude’) ;
subplot(2,2,3)
d3 = [0:.20:1];
% 5 cycles
y3 = pulstran(t,d3,’tripuls’,.1);
plot(t,y3);
title(‘5 triangular cycles’);
axis ([0 1 -0.5 1.5]);
xlabel(‘time’)
ylabel(‘Amplitude’) ;
d4 = [0:.5:1];
% 2 cycles
subplot(2,2,4)
y4 = pulstran(t,d4,’tripuls’,.4);
plot (t,y4)
Plot using (squar, t) = gensig(square,3,9,0.1)
1
0.8
Amplitude
0.6
0.4
0.2
0
0
1
2
3
4
5
6
7
8
9
time
FIGURE 1.35
Plot of R.1.117.
CRC_47760_CH001.indd 39
CRC_47760_CH001.indd 39
7/25/2008 4:16:18 PM
7/25/2008 4:16:18 PM