

444
Practical MATLAB
® Applications for Engineers
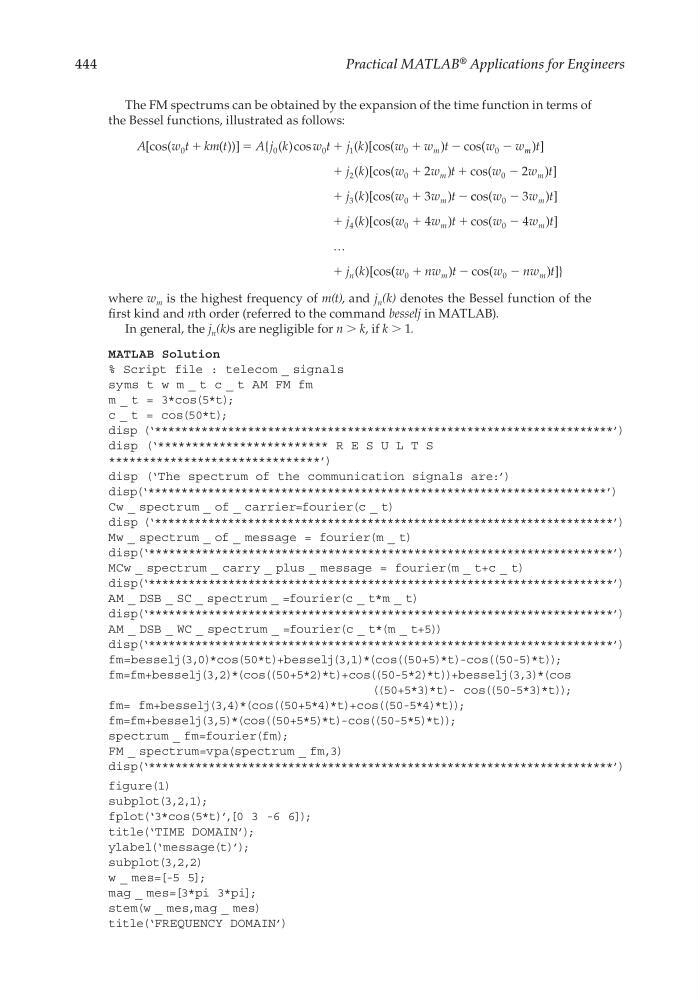
The FM spectrums can be obtained by the expansion of the time function in terms of
the Bessel functions, illustrated as follows:
A
w t kmt
A j k
w t j k
w
w t
w
w
m
[cos(
( ))]
{ ( )cos
( )[cos(
) cos(
0
0
0
1
0
0
ϩ
ϭ
ϩ
ϩ
Ϫ
Ϫ m m
m
m
m
t
j k
w
w t
w
w t
j k
w
w t
) ]
( )[cos(
) cos(
) ]
( )[cos(
)
ϩ
ϩ
ϩ
ϩ
ϩ
2
0
0
3
0
2
2
3
Ϫ
Ϫ c cos(
) ]
( )[cos(
) cos(
) ]
( )[cos
w
w t
j k
w
w t
w
w t
j k
m
m
m
n
0
4
0
0
3
4
4
Ϫ
Ϫ
ϩ
ϩ
ϩ
ϩ
…
( (
)
c o s (
)] }
w
nw t
w
nw t
m
m
0
0
ϩ
Ϫ
Ϫ
where w m is the highest frequency of m(t), and j n (k) denotes the Bessel function of the
fi rst kind and nth order (referred to the command besselj in MATLAB).
In general, the j n (k)s are negligible for n > k, if k > 1.
MATLAB Solution
% Script file : telecom _ signals
syms t w m _ t c _ t AM FM fm
m _ t = 3*cos(5*t);
c _ t = cos(50*t);
disp (‘*********************************************************************’)
disp (‘************************* R E S U L T S
*******************************’)
disp (‘The spectrum of the communication signals are:’)
disp(‘*********************************************************************’)
Cw _ spectrum _ of _ carrier=fourier(c _ t)
disp (‘*********************************************************************’)
Mw _ spectrum _ of _ message = fourier(m _ t)
disp(‘**********************************************************************’)
MCw _ spectrum _ carry _ plus _ message = fourier(m _ t+c _ t)
disp(‘**********************************************************************’)
AM _ DSB _ SC _ spectrum _ =fourier(c _ t*m _ t)
disp(‘**********************************************************************’)
AM _ DSB _ WC _ spectrum _ =fourier(c _ t*(m _ t+5))
disp(‘**********************************************************************’)
fm=besselj(3,0)*cos(50*t)+besselj(3,1)*(cos((50+5)*t)-cos((50-5)*t));
fm=fm+besselj(3,2)*(cos((50+5*2)*t)+cos((50-5*2)*t))+besselj(3,3)*(cos
((50+5*3)*t)- cos((50-5*3)*t));
fm= fm+besselj(3,4)*(cos((50+5*4)*t)+cos((50-5*4)*t));
fm=fm+besselj(3,5)*(cos((50+5*5)*t)-cos((50-5*5)*t));
spectrum _ fm=fourier(fm);
FM _ spectrum=vpa(spectrum _ fm,3)
disp(‘**********************************************************************’)
figure(1)
subplot(3,2,1);
fplot(‘3*cos(5*t)’,[0 3 -6 6]);
title(‘TIME DOMAIN’);
ylabel(‘message(t)’);
subplot(3,2,2)
w _ mes=[-5 5];
mag _ mes=[3*pi 3*pi];
stem(w _ mes,mag _ mes)
title(‘FREQUENCY DOMAIN’)
CRC_47760_CH004.indd 444
CRC_47760_CH004.indd 444
7/28/2008 12:26:23 PM
7/28/2008 12:26:23 PM
Practical MATLAB
® Applications for Engineers
The FM spectrums can be obtained by the expansion of the time function in terms of
the Bessel functions, illustrated as follows:
A
w t kmt
A j k
w t j k
w
w t
w
w
m
[cos(
( ))]
{ ( )cos
( )[cos(
) cos(
0
0
0
1
0
0
ϩ
ϭ
ϩ
ϩ
Ϫ
Ϫ m m
m
m
m
t
j k
w
w t
w
w t
j k
w
w t
) ]
( )[cos(
) cos(
) ]
( )[cos(
)
ϩ
ϩ
ϩ
ϩ
ϩ
2
0
0
3
0
2
2
3
Ϫ
Ϫ c cos(
) ]
( )[cos(
) cos(
) ]
( )[cos
w
w t
j k
w
w t
w
w t
j k
m
m
m
n
0
4
0
0
3
4
4
Ϫ
Ϫ
ϩ
ϩ
ϩ
ϩ
…
( (
)
c o s (
)] }
w
nw t
w
nw t
m
m
0
0
ϩ
Ϫ
Ϫ
where w m is the highest frequency of m(t), and j n (k) denotes the Bessel function of the
fi rst kind and nth order (referred to the command besselj in MATLAB).
In general, the j n (k)s are negligible for n > k, if k > 1.
MATLAB Solution
% Script file : telecom _ signals
syms t w m _ t c _ t AM FM fm
m _ t = 3*cos(5*t);
c _ t = cos(50*t);
disp (‘*********************************************************************’)
disp (‘************************* R E S U L T S
*******************************’)
disp (‘The spectrum of the communication signals are:’)
disp(‘*********************************************************************’)
Cw _ spectrum _ of _ carrier=fourier(c _ t)
disp (‘*********************************************************************’)
Mw _ spectrum _ of _ message = fourier(m _ t)
disp(‘**********************************************************************’)
MCw _ spectrum _ carry _ plus _ message = fourier(m _ t+c _ t)
disp(‘**********************************************************************’)
AM _ DSB _ SC _ spectrum _ =fourier(c _ t*m _ t)
disp(‘**********************************************************************’)
AM _ DSB _ WC _ spectrum _ =fourier(c _ t*(m _ t+5))
disp(‘**********************************************************************’)
fm=besselj(3,0)*cos(50*t)+besselj(3,1)*(cos((50+5)*t)-cos((50-5)*t));
fm=fm+besselj(3,2)*(cos((50+5*2)*t)+cos((50-5*2)*t))+besselj(3,3)*(cos
((50+5*3)*t)- cos((50-5*3)*t));
fm= fm+besselj(3,4)*(cos((50+5*4)*t)+cos((50-5*4)*t));
fm=fm+besselj(3,5)*(cos((50+5*5)*t)-cos((50-5*5)*t));
spectrum _ fm=fourier(fm);
FM _ spectrum=vpa(spectrum _ fm,3)
disp(‘**********************************************************************’)
figure(1)
subplot(3,2,1);
fplot(‘3*cos(5*t)’,[0 3 -6 6]);
title(‘TIME DOMAIN’);
ylabel(‘message(t)’);
subplot(3,2,2)
w _ mes=[-5 5];
mag _ mes=[3*pi 3*pi];
stem(w _ mes,mag _ mes)
title(‘FREQUENCY DOMAIN’)
CRC_47760_CH004.indd 444
CRC_47760_CH004.indd 444
7/28/2008 12:26:23 PM
7/28/2008 12:26:23 PM