

408
Practical MATLAB
® Applications for Engineers
Example 4.10
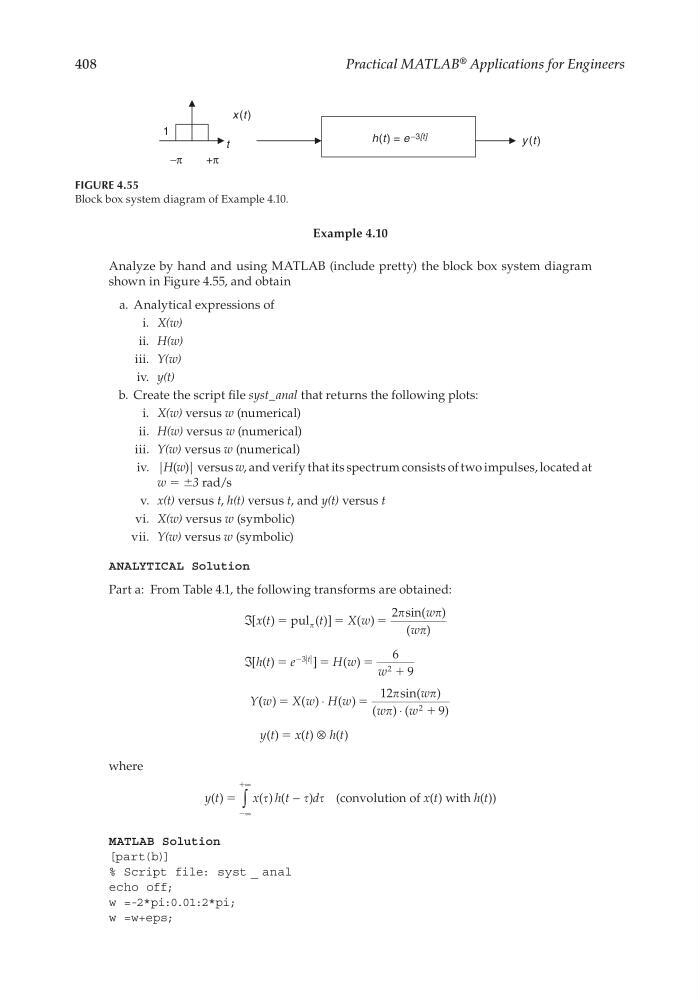
Analyze by hand and using MATLAB (include pretty) the block box system diagram
shown in Figure 4.55, and obtain
a. Analytical expressions of
i. X(w)
ii. H(w)
iii. Y(w)
iv. y(t)
b. Create the script fi le syst_anal that returns the following plots:
i. X(w) versus w (numerical)
ii. H(w) versus w (numerical)
iii. Y(w) versus w (numerical)
iv. |H(w)| versus w, and verify that its spectrum consists of two impulses, located at
w = ±3 rad/s
v. x(t) versus t, h(t) versus t, and y(t) versus t
vi. X(w) versus w (symbolic)
vii. Y(w) versus w (symbolic)
ANALYTICAL Solution
Part a: From Table 4.1, the following transforms are obtained:
ℑ
ℑ
[ ( )
( )]
( )
( )
( )
[ ( )
]
( )
x t
t
X w
w
w
h t
e
H w
w
Y
t
ϭ
ϭ
ϭ
ϭ
ϭ
ϭ
ϩ
pul
sin
2
6
9
3
2
Ϫ
( ( )
( ) ( )
sin( )
( ) (
)
( )
( )
( )
w
X w H w
w
w
w
y t
x t
h t
ϭ
ϭ
ϩ
ϭ
⋅
⋅
⊗
12
9
2
where
y t
x h t
d
x t
h t
( )
( ) (
)
( )
( )
ϭ
Ϫ
ϩ
−
∞
∞
∫
(convolution of
with
)
MATLAB Solution
[part(b)]
% Script file: syst _ anal
echo off;
w =-2*pi:0.01:2*pi;
w =w+eps;
h(t ) = e −3[t]
−π
+π
x (t )
y (t )
t
1
FIGURE 4.55
Block box system diagram of Example 4.10.
CRC_47760_CH004.indd 408
CRC_47760_CH004.indd 408
7/28/2008 12:26:13 PM
7/28/2008 12:26:13 PM
Practical MATLAB
® Applications for Engineers
Example 4.10
Analyze by hand and using MATLAB (include pretty) the block box system diagram
shown in Figure 4.55, and obtain
a. Analytical expressions of
i. X(w)
ii. H(w)
iii. Y(w)
iv. y(t)
b. Create the script fi le syst_anal that returns the following plots:
i. X(w) versus w (numerical)
ii. H(w) versus w (numerical)
iii. Y(w) versus w (numerical)
iv. |H(w)| versus w, and verify that its spectrum consists of two impulses, located at
w = ±3 rad/s
v. x(t) versus t, h(t) versus t, and y(t) versus t
vi. X(w) versus w (symbolic)
vii. Y(w) versus w (symbolic)
ANALYTICAL Solution
Part a: From Table 4.1, the following transforms are obtained:
ℑ
ℑ
[ ( )
( )]
( )
( )
( )
[ ( )
]
( )
x t
t
X w
w
w
h t
e
H w
w
Y
t
ϭ
ϭ
ϭ
ϭ
ϭ
ϭ
ϩ
pul
sin
2
6
9
3
2
Ϫ
( ( )
( ) ( )
sin( )
( ) (
)
( )
( )
( )
w
X w H w
w
w
w
y t
x t
h t
ϭ
ϭ
ϩ
ϭ
⋅
⋅
⊗
12
9
2
where
y t
x h t
d
x t
h t
( )
( ) (
)
( )
( )
ϭ
Ϫ
ϩ
−
∞
∞
∫
(convolution of
with
)
MATLAB Solution
[part(b)]
% Script file: syst _ anal
echo off;
w =-2*pi:0.01:2*pi;
w =w+eps;
h(t ) = e −3[t]
−π
+π
x (t )
y (t )
t
1
FIGURE 4.55
Block box system diagram of Example 4.10.
CRC_47760_CH004.indd 408
CRC_47760_CH004.indd 408
7/28/2008 12:26:13 PM
7/28/2008 12:26:13 PM