

Fourier and Laplace
371
R.4.126 The MATLAB function spectrum(x) returns the script fi le specpsd is executed and
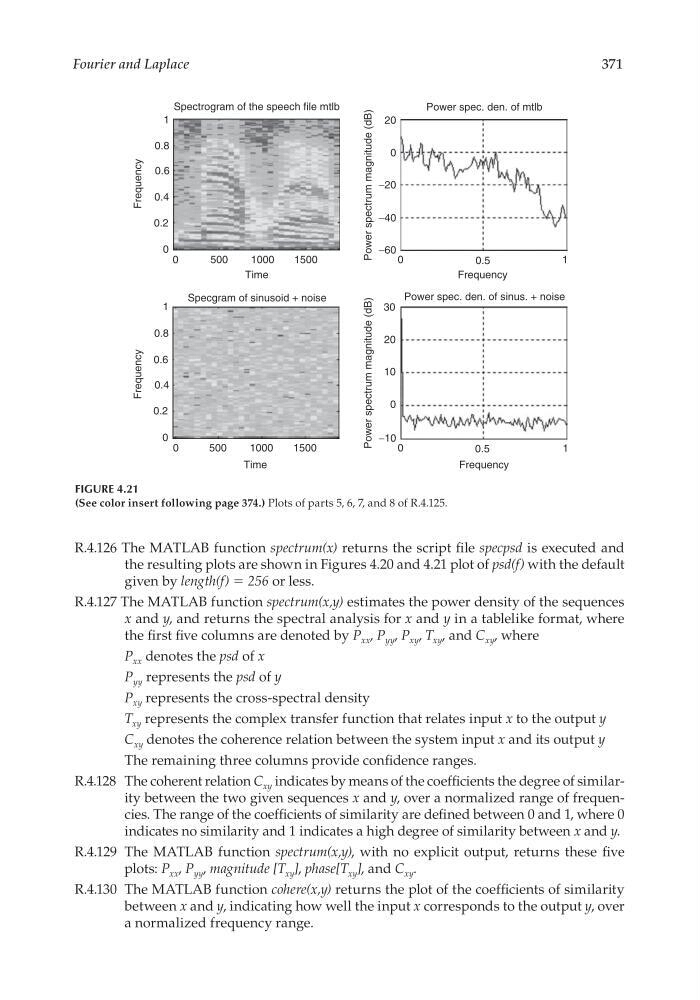
the resulting plots are shown in Figures 4.20 and 4.21 plot of psd(f) with the default
given by length(f) = 256 or less.
R.4.127 The MATLAB function spectrum(x,y) estimates the power density of the sequences
x and y, and returns the spectral analysis for x and y in a tablelike format, where
the fi rst fi ve columns are denoted by P xx , P yy , P xy , T xy , and C xy , where
P xx denotes the psd of x
P yy represents the psd of y
P xy represents the cross-spectral density
T xy represents the complex transfer function that relates input x to the output y
C xy denotes the coherence relation between the system input x and its output y
The remaining three columns provide confi dence ranges.
R.4.128 The coherent relation C xy indicates by means of the coeffi cients the degree of similarity between the two given sequences x and y, over a normalized range of frequencies. The range of the coeffi cients of similarity are defi ned between 0 and 1, where 0
indicates no similarity and 1 indicates a high degree of similarity between x and y.
R.4.129 The MATLAB function spectrum(x,y), with no explicit output, returns these fi ve
plots: P xx , P yy , magnitude [T xy ], phase[T xy ], and C xy .
R.4.130 The MATLAB function cohere(x,y) returns the plot of the coeffi cients of similarity
between x and y, indicating how well the input x corresponds to the output y, over
a normalized frequency range.
Spectrogram of the speech file mtlb
1
0.8
0.6
0.4
0.2
0
0
Frequency
500
1000
1500
Time
Specgram of sinusoid + noise
1
0.8
0.6
0.4
0.2
0
Frequency
0
500
1000
1500
Time
Power spec. den. of mtlb
Frequency
Power spec. den. of sinus. + noise
20
−20
−40
−60
0
0
0.5
1
Power spectrum magnitude (dB)
30
20
10
0
0
0.5
1
−10
Frequency
Power spectrum magnitude (dB)
FIGURE 4.21
(See color insert following page 374.) Plots of parts 5, 6, 7, and 8 of R.4.125.
CRC_47760_CH004.indd 371
CRC_47760_CH004.indd 371
7/28/2008 12:26:05 PM
7/28/2008 12:26:05 PM
371
R.4.126 The MATLAB function spectrum(x) returns the script fi le specpsd is executed and
the resulting plots are shown in Figures 4.20 and 4.21 plot of psd(f) with the default
given by length(f) = 256 or less.
R.4.127 The MATLAB function spectrum(x,y) estimates the power density of the sequences
x and y, and returns the spectral analysis for x and y in a tablelike format, where
the fi rst fi ve columns are denoted by P xx , P yy , P xy , T xy , and C xy , where
P xx denotes the psd of x
P yy represents the psd of y
P xy represents the cross-spectral density
T xy represents the complex transfer function that relates input x to the output y
C xy denotes the coherence relation between the system input x and its output y
The remaining three columns provide confi dence ranges.
R.4.128 The coherent relation C xy indicates by means of the coeffi cients the degree of similarity between the two given sequences x and y, over a normalized range of frequencies. The range of the coeffi cients of similarity are defi ned between 0 and 1, where 0
indicates no similarity and 1 indicates a high degree of similarity between x and y.
R.4.129 The MATLAB function spectrum(x,y), with no explicit output, returns these fi ve
plots: P xx , P yy , magnitude [T xy ], phase[T xy ], and C xy .
R.4.130 The MATLAB function cohere(x,y) returns the plot of the coeffi cients of similarity
between x and y, indicating how well the input x corresponds to the output y, over
a normalized frequency range.
Spectrogram of the speech file mtlb
1
0.8
0.6
0.4
0.2
0
0
Frequency
500
1000
1500
Time
Specgram of sinusoid + noise
1
0.8
0.6
0.4
0.2
0
Frequency
0
500
1000
1500
Time
Power spec. den. of mtlb
Frequency
Power spec. den. of sinus. + noise
20
−20
−40
−60
0
0
0.5
1
Power spectrum magnitude (dB)
30
20
10
0
0
0.5
1
−10
Frequency
Power spectrum magnitude (dB)
FIGURE 4.21
(See color insert following page 374.) Plots of parts 5, 6, 7, and 8 of R.4.125.
CRC_47760_CH004.indd 371
CRC_47760_CH004.indd 371
7/28/2008 12:26:05 PM
7/28/2008 12:26:05 PM