

288
Practical MATLAB
® Applications for Engineers
Example 3.13
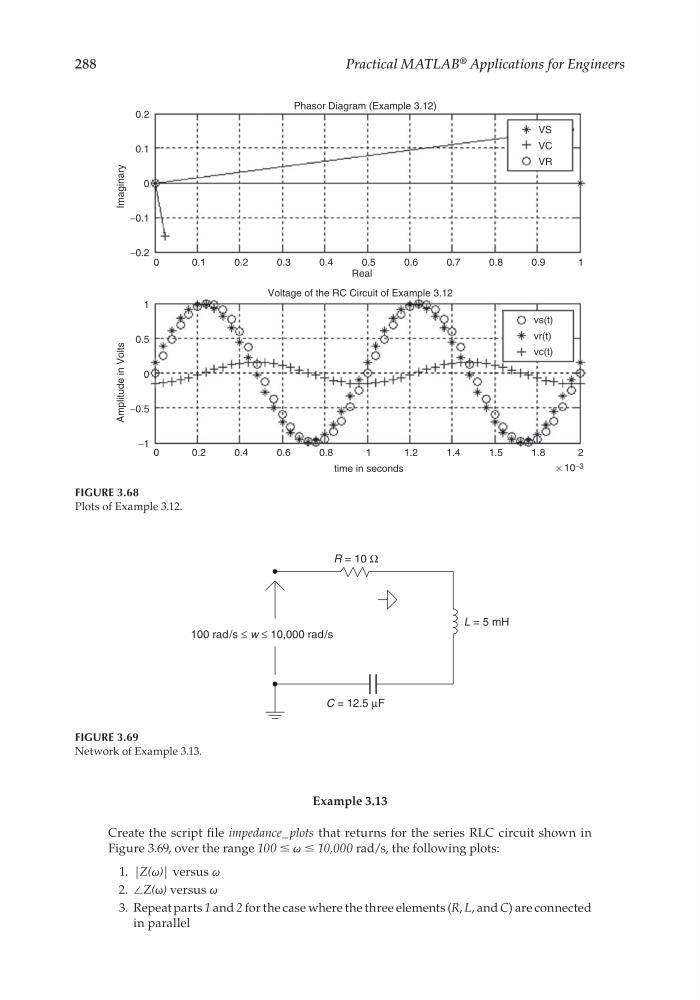
Create the script fi le impedance_ plots that returns for the series RLC circuit shown in
Figure 3.69, over the range 100 ≤ ω ≤ 10,000 rad/s, the following plots:
1. |Z(ω)| versus ω
2. ∠Z(ω) versus ω
3. Repeat parts 1 and 2 for the case where the three elements (R, L, and C) are connected
in parallel
R = 10 Ω
C = 12.5 µF
L = 5 mH
100 rad/s ≤ w ≤ 10,000 rad/s
FIGURE 3.69
Network of Example 3.13.
0.2
0.1
0
0
0.1
1
0
0.2
0.3
0.4
0.5
0.5
−0.5
−1
Real
Voltage of the RC Circuit of Example 3.12
0.6
0.7
0.8
0.9
1
0
0.2
0.4
0.6
0.8
1
time in seconds
1.2
1.4
1.5
1.8
× 10 −3
2
−0.1
−0.2
Amplitude in Volts
Imaginary
VS
VC
VR
vs(t)
vr(t)
vc(t)
Phasor Diagram (Example 3.12)
FIGURE 3.68
Plots of Example 3.12.
CRC_47760_CH003.indd 288
CRC_47760_CH003.indd 288
7/23/2008 1:27:49 PM
7/23/2008 1:27:49 PM
Practical MATLAB
® Applications for Engineers
Example 3.13
Create the script fi le impedance_ plots that returns for the series RLC circuit shown in
Figure 3.69, over the range 100 ≤ ω ≤ 10,000 rad/s, the following plots:
1. |Z(ω)| versus ω
2. ∠Z(ω) versus ω
3. Repeat parts 1 and 2 for the case where the three elements (R, L, and C) are connected
in parallel
R = 10 Ω
C = 12.5 µF
L = 5 mH
100 rad/s ≤ w ≤ 10,000 rad/s
FIGURE 3.69
Network of Example 3.13.
0.2
0.1
0
0
0.1
1
0
0.2
0.3
0.4
0.5
0.5
−0.5
−1
Real
Voltage of the RC Circuit of Example 3.12
0.6
0.7
0.8
0.9
1
0
0.2
0.4
0.6
0.8
1
time in seconds
1.2
1.4
1.5
1.8
× 10 −3
2
−0.1
−0.2
Amplitude in Volts
Imaginary
VS
VC
VR
vs(t)
vr(t)
vc(t)
Phasor Diagram (Example 3.12)
FIGURE 3.68
Plots of Example 3.12.
CRC_47760_CH003.indd 288
CRC_47760_CH003.indd 288
7/23/2008 1:27:49 PM
7/23/2008 1:27:49 PM