

Alternating Current Analysis
281
0
0.5
1
1.5
2
2.5
3
3.5
4
4.5
5
0
0.5
1
1.5
Magnitude and phase of Z(w)
w (rad/sec)
0
0.5
1
1.5
2
2.5
3
3.5
4
4.5
5
w (rad/sec)
magnitude
−200
−150
−100
−50
0
phase in degrees
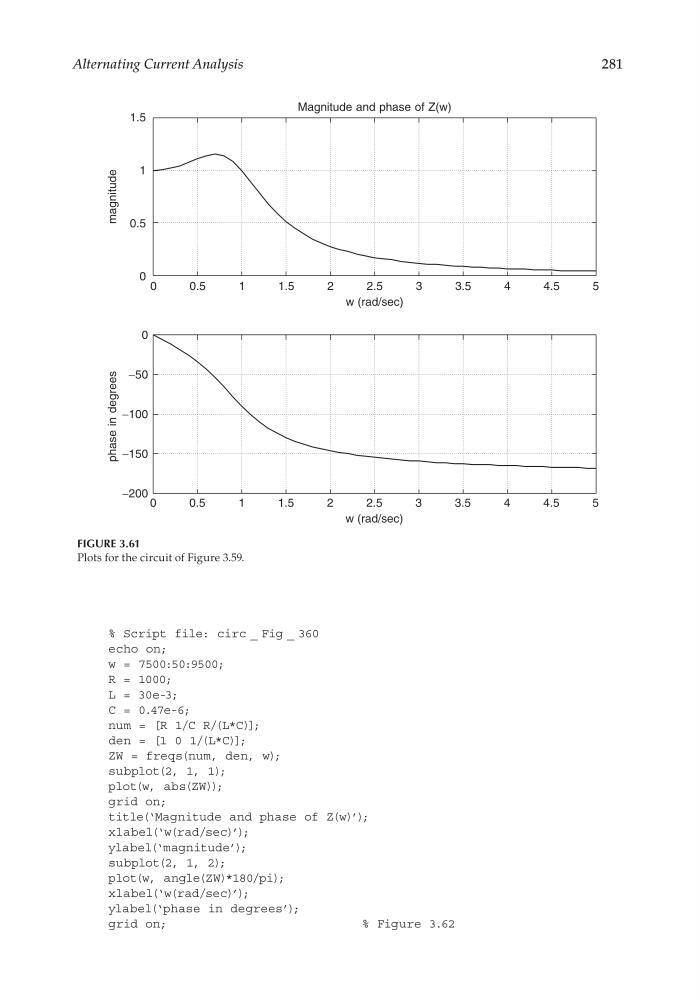
FIGURE 3.61
Plots for the circuit of Figure 3.59.
% Script file: circ _ Fig _ 360
echo on;
w = 7500:50:9500;
R = 1000;
L = 30e-3;
C = 0.47e-6;
num = [R 1/C R/(L*C)];
den = [1 0 1/(L*C)];
ZW = freqs(num, den, w);
subplot(2, 1, 1);
plot(w, abs(ZW));
grid on;
title(‘Magnitude and phase of Z(w)’);
xlabel(‘w(rad/sec)’);
ylabel(‘magnitude’);
subplot(2, 1, 2);
plot(w, angle(ZW)*180/pi);
xlabel(‘w(rad/sec)’);
ylabel(‘phase in degrees’);
grid on;
% Figure 3.62
CRC_47760_CH003.indd 281
CRC_47760_CH003.indd 281
7/23/2008 1:27:47 PM
7/23/2008 1:27:47 PM
281
0
0.5
1
1.5
2
2.5
3
3.5
4
4.5
5
0
0.5
1
1.5
Magnitude and phase of Z(w)
w (rad/sec)
0
0.5
1
1.5
2
2.5
3
3.5
4
4.5
5
w (rad/sec)
magnitude
−200
−150
−100
−50
0
phase in degrees
FIGURE 3.61
Plots for the circuit of Figure 3.59.
% Script file: circ _ Fig _ 360
echo on;
w = 7500:50:9500;
R = 1000;
L = 30e-3;
C = 0.47e-6;
num = [R 1/C R/(L*C)];
den = [1 0 1/(L*C)];
ZW = freqs(num, den, w);
subplot(2, 1, 1);
plot(w, abs(ZW));
grid on;
title(‘Magnitude and phase of Z(w)’);
xlabel(‘w(rad/sec)’);
ylabel(‘magnitude’);
subplot(2, 1, 2);
plot(w, angle(ZW)*180/pi);
xlabel(‘w(rad/sec)’);
ylabel(‘phase in degrees’);
grid on;
% Figure 3.62
CRC_47760_CH003.indd 281
CRC_47760_CH003.indd 281
7/23/2008 1:27:47 PM
7/23/2008 1:27:47 PM