

274
Practical MATLAB
® Applications for Engineers
MATLAB Solution
% Script file: curr _ volt
W = 300;
R = 19;
L = 60e-3;
Ang = W*L/R;
t = [0:.0001:.06];
V = (R^2+(W*L)^2)^.5*5*sin(W.*t+atan(Ang));
subplot(2,1,1)
I = 5*sin(W.*t);
plot (t,V), title(‘ v(t) vs. t’)
grid on
ylabel(‘Amplitude in volts’), title(‘v(t) vs.t’)
subplot(2,1,2)
plot(t,I)
grid on
title(‘i(t) vs. t’), ylabel(‘ Amplitude in amps’)
xlabel(‘time in sec.’)
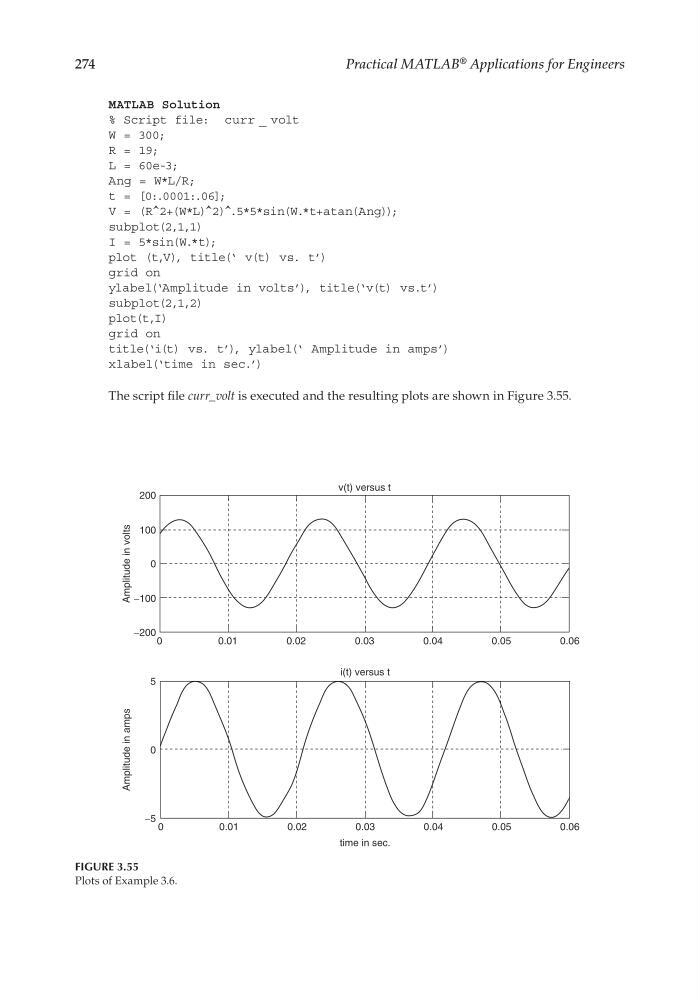
The script fi le curr_volt is executed and the resulting plots are shown in Figure 3.55.
FIGURE 3.55
Plots of Example 3.6.
200
100
0
0
0
0.01
0.02
0.03
0.04
0.05
0.06
0
0.01
0.02
0.03
time in sec.
0.04
0.05
0.06
−100
−200
−5
v(t) versus t
i(t) versus t
Amplitude in volts
Amplitude in amps
5
CRC_47760_CH003.indd 274
CRC_47760_CH003.indd 274
7/23/2008 1:27:45 PM
7/23/2008 1:27:45 PM
Practical MATLAB
® Applications for Engineers
MATLAB Solution
% Script file: curr _ volt
W = 300;
R = 19;
L = 60e-3;
Ang = W*L/R;
t = [0:.0001:.06];
V = (R^2+(W*L)^2)^.5*5*sin(W.*t+atan(Ang));
subplot(2,1,1)
I = 5*sin(W.*t);
plot (t,V), title(‘ v(t) vs. t’)
grid on
ylabel(‘Amplitude in volts’), title(‘v(t) vs.t’)
subplot(2,1,2)
plot(t,I)
grid on
title(‘i(t) vs. t’), ylabel(‘ Amplitude in amps’)
xlabel(‘time in sec.’)
The script fi le curr_volt is executed and the resulting plots are shown in Figure 3.55.
FIGURE 3.55
Plots of Example 3.6.
200
100
0
0
0
0.01
0.02
0.03
0.04
0.05
0.06
0
0.01
0.02
0.03
time in sec.
0.04
0.05
0.06
−100
−200
−5
v(t) versus t
i(t) versus t
Amplitude in volts
Amplitude in amps
5
CRC_47760_CH003.indd 274
CRC_47760_CH003.indd 274
7/23/2008 1:27:45 PM
7/23/2008 1:27:45 PM