

212
Practical MATLAB
® Applications for Engineers
Write a program that returns the following plots:
a. I versus V AB
b. I versus V BC
c. I versus I 1
d. I versus I 3
e. I versus power (R 1 ʈ R 2 )
P.2.16 The voltage source V 0 shown in Figure 2.112, varies from 10 to 100 V in steps (increments) of 5 V. Write a program that returns the following plots:
a. V 0 versus I 1
b. V 0 versus V R5
c. V 0 versus I 2
d. V 0 versus I 5
e. V 0 versus power of R 2
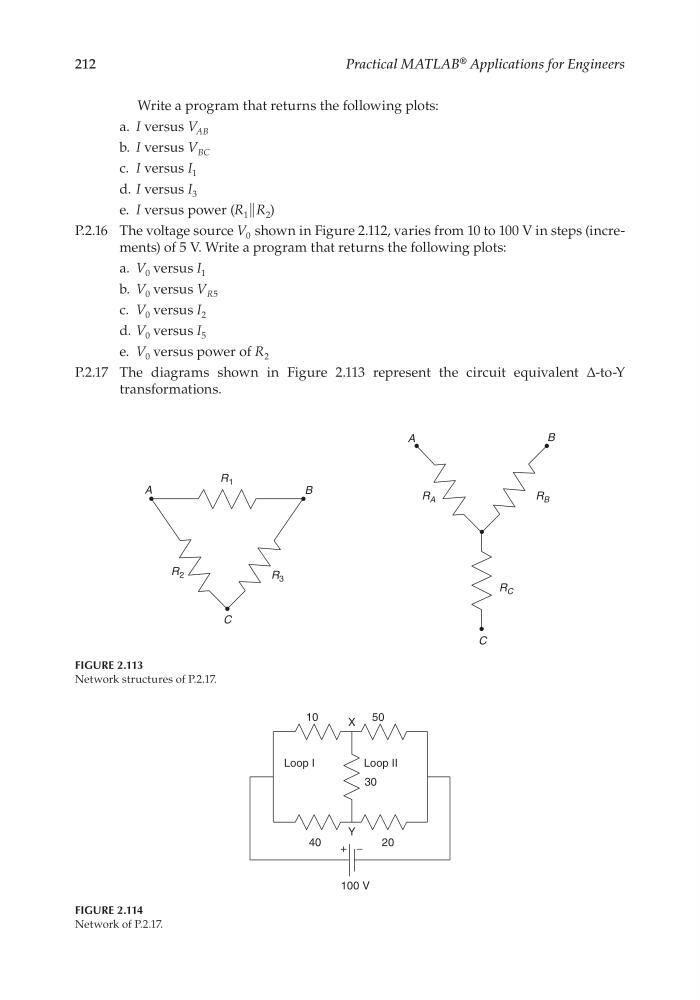
P.2.17 The diagrams shown in Figure 2.113 represent the circuit equivalent ∆-to-Y
transformations.
FIGURE 2.113
Network structures of P.2.17.
B
A
C
A
B
C
R 1
R 2
R 3
R A
R B
R C
FIGURE 2.114
Network of P.2.17.
100 V
Y
X
10
50
40
+ −
20
30
Loop II
Loop I
CRC_47760_CH002.indd 212
CRC_47760_CH002.indd 212
7/23/2008 1:39:03 PM
7/23/2008 1:39:03 PM
Practical MATLAB
® Applications for Engineers
Write a program that returns the following plots:
a. I versus V AB
b. I versus V BC
c. I versus I 1
d. I versus I 3
e. I versus power (R 1 ʈ R 2 )
P.2.16 The voltage source V 0 shown in Figure 2.112, varies from 10 to 100 V in steps (increments) of 5 V. Write a program that returns the following plots:
a. V 0 versus I 1
b. V 0 versus V R5
c. V 0 versus I 2
d. V 0 versus I 5
e. V 0 versus power of R 2
P.2.17 The diagrams shown in Figure 2.113 represent the circuit equivalent ∆-to-Y
transformations.
FIGURE 2.113
Network structures of P.2.17.
B
A
C
A
B
C
R 1
R 2
R 3
R A
R B
R C
FIGURE 2.114
Network of P.2.17.
100 V
Y
X
10
50
40
+ −
20
30
Loop II
Loop I
CRC_47760_CH002.indd 212
CRC_47760_CH002.indd 212
7/23/2008 1:39:03 PM
7/23/2008 1:39:03 PM